Quality Analyst
With the future in mind, NWA Quality Analyst® 7 is engineered for peak performance with upgraded technology, updated user interface and database connectivity.
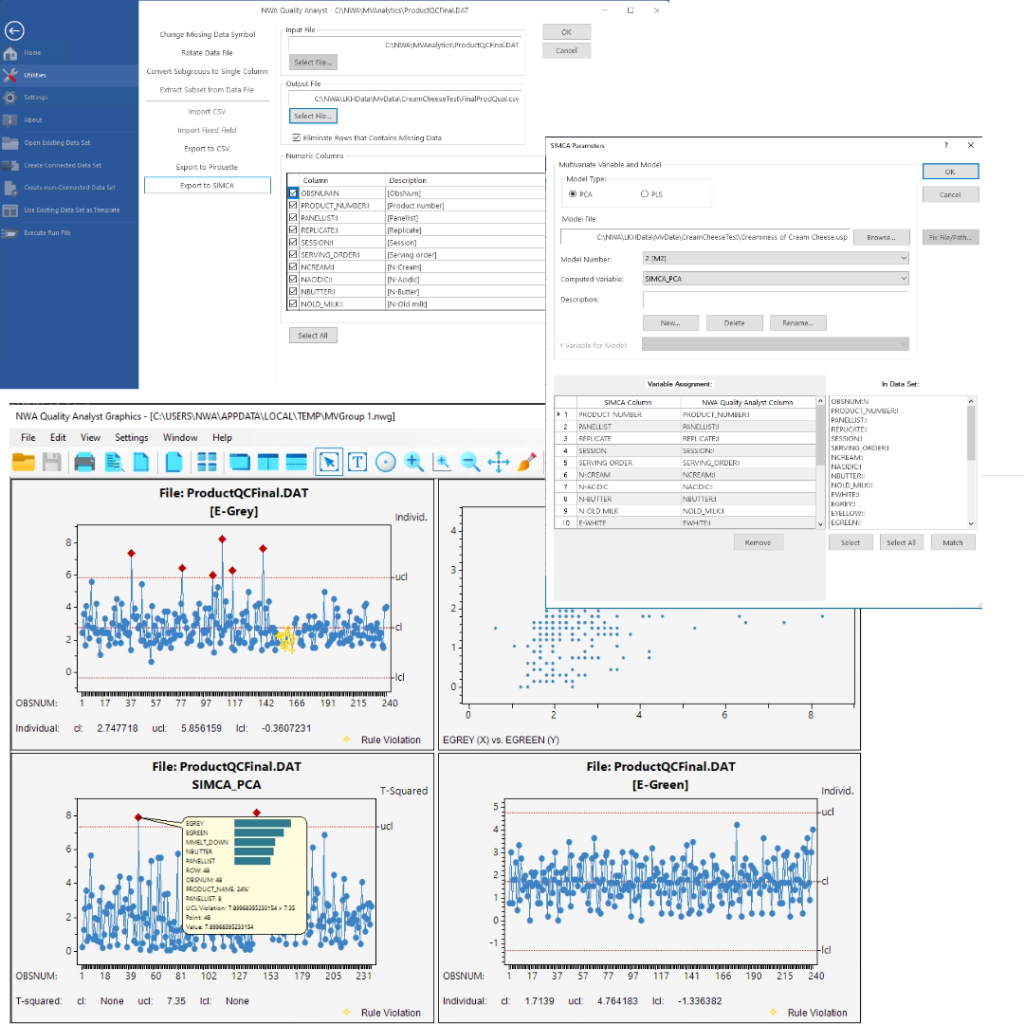
NWA Quality Analyst® is an award-winning SPC charting and analysis software solution that puts the data in the hands of the decision makers with the best combination of power, flexibility, and ease-of-use of any SPC software available. Trusted by manufacturers since 1982, NWA Quality Analyst continues to enable a wide range of users to graphically analyze process behavior to optimize product quality, minimize cost and optimize product quality and reduce risk with minimal training in statistical techniques.
.png)
.png)
.png)
Ease of Use
NWA Quality Analyst combines comprehensive charting and analysis capabilities with interactive operation to turn your data into valuable information. Developed for ease of use, NWA Quality Analyst provides:
- Fast, simple charting—from start to chart in as few as three mouse clicks
- Simple, direct data and chart setup
- Multiple chart displays and printing with drag-and-drop page layout
- Easy, wizard-guided automation
- Straightforward connection to external databases
Power
NWA Quality Analyst’s operational power is available directly from the spreadsheet-like user interface, providing:
- Access to all configuration, charting, and analytical functions from a single screen
- A suite of advanced data management tools
- A robust data structure allowing all charting and analysis from a single data set
- User-defined calculated variables (including a visual equation builder), multi-key data sorting, and multi-criteria data filtering
- Pop-up windows displaying descriptive characteristics and rule violations for any point on a chart
Flexibility
When it comes to setting up charts for specific analytical needs, NWA Quality Analyst offers unmatched flexibility and versatility. User preferences can be set using clear, logical, consistent dialogs. While default settings produce the most commonly accepted form, charts can be quickly customized. You can define any chart to meet internal, customer, or regulatory requirements, for example:
- Combine attribute, measurement, and descriptive information in the same data set
- Select from more than 20 process capability indices and 8 distributions
- Select from 19 patterns and run rules, or create your own
- Choose fonts, colors, aspect ratios, and annotations to create presentation quality graphics
.png)


NWA Quality Analyst Quick Links
For additional resources and information:
- LIMITED TIME: Lunch & Learn Webinar Series (Requires Registration)
- Features & Benefits
- System Requirements
- Case Studies | Articles | Whitepaper | Webinars (Requires Registration)
- Full list of Functional Specifications
- Start Your Free 30 Day Trial (Requires Registration)