When glass-container company Saint-Gobain Containers (formerly Ball-Foster Glass Container) implemented a company-wide quality program across its 18 plants, the company standardized its quality data management with NWA Quality Analyst software from Northwest Analytical, Inc.
"Our quality has always been very good, but to be the best in this marketplace, we wanted even higher levels of efficiency, productivity and quality," says Mike Puhl, corporate senior process engineer. "Standardizing on NWA QA has created efficiencies and easy comparisons."
With 18 U.S. plants, Saint-Gobain makes between 1000-1500 different glass container products. Inside the plants sand, soda ash and limestone are mixed with recycled glass and fed into a furnace, which melts the glass at 2700 degrees F over about 24 hours. After going through a temperature conditioning unit, the glass is cut into pieces that are the exact weight of the finished jar or bottle. The pieces are then dropped into a forming machine and then transferred onto a conveyor for hot-end coating. Then a cold-end coating is applied, and the finished bottles are inspected for multiple criteria such as thickness, cracks and bubbles.
During the process, NWA Quality Analyst is used to chart variables such as temperature in the hot-end coating hood, temperature of glass at cold-end coating, flow rates and furnace temperatures. If the control charts show data points trending outside of the upper and lower control limits, mid-course corrections can be made before defects are produced.
"We focus on key characteristics of large-volume products," says Puhl. "That's where the quality program can make the most difference."
Because NWA QA is off-line software, St. Gobain also uses it to see the big picture in terms of how processes perform over time. The software makes it easy to compare data collected over days, weeks, months and even years, allowing them to spot large trends and unusual patterns that might otherwise be missed in the day-to-day views. They also use the software for Pareto analysis of customer complaints, sorting them by defect types to help prioritize quality efforts.
Creating Savings on Expensive Equipment
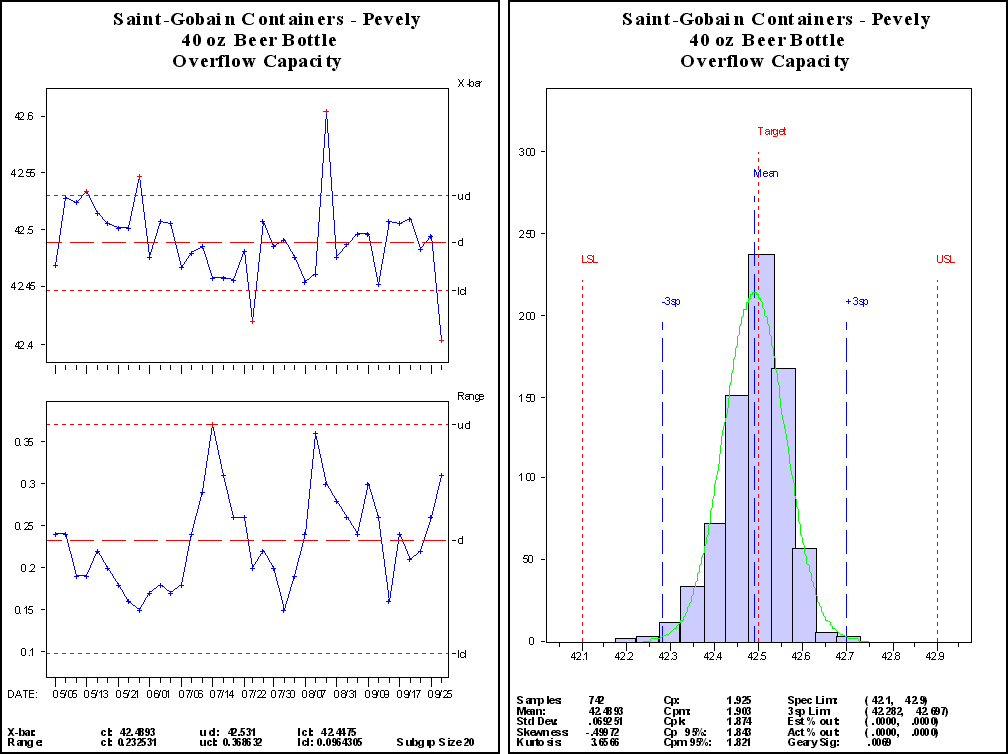
Saint-Gobain's Pevely, MO, plant manufactures more than three million beer bottles per day. One way they use NWA QA is to monitor and extend the life of bottle molds.
Molds break down over time and need retooling or replacing at a cost of between $50,000 to $60,000. Replacing a mold too early -- before it is necessary -- reduces capacity and increases costs. Replacing the mold too late causes product scrap and rejects.
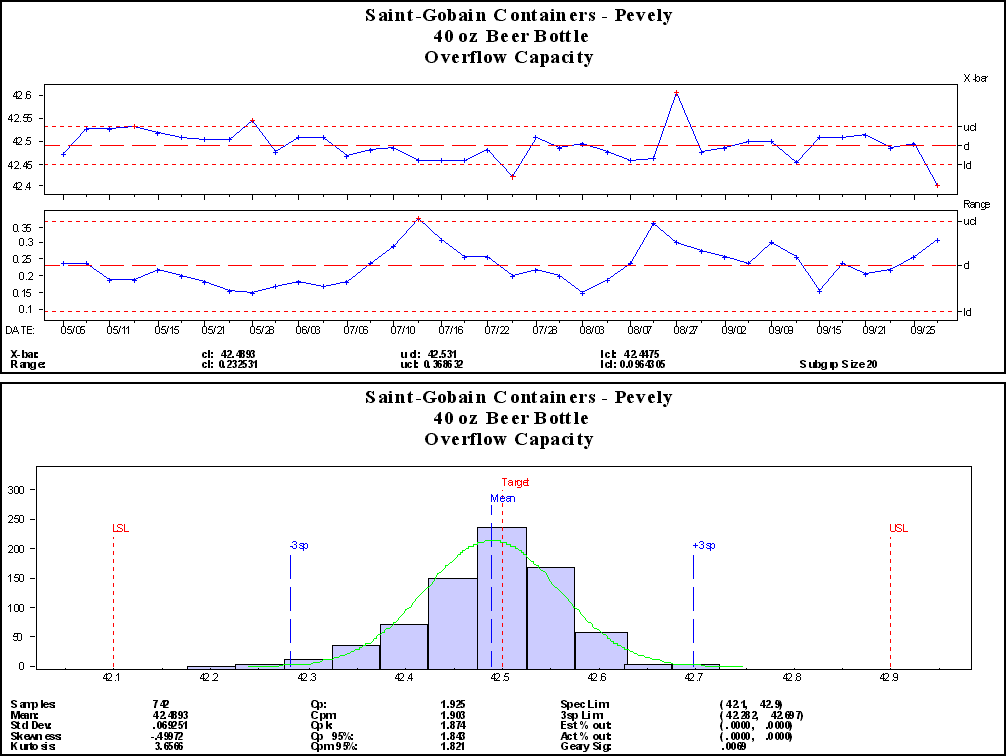 By control charting container capacity measurements, the plant can determine more exactly when to make process adjustments to keep the product on target and extend mold life. "If a product is budgeted for four molds in a year and we only use three, that $50,000 goes straight to the bottom line," says Paul Delaney, plant QC manager. "And if you consider that each machine produces 20 to 40 products, each with their own set of molds, you can see there is great potential for savings."
 The plant also uses NWA Quality Analyst to track yields (how many bottles make it into final inspection from production). They monitor a production shop's 30-day daily performance against its % pack (yield) target and review reasons for deviations. Using the software in their daily production meetings allows the whole team to review shop performance data, calculating and projecting control charts, histograms and statistics on a screen for everyone to see.
Delaney says pursuing SQC with the NWA software has many benefits:
- It allows for comparisons between areas, shops, tools and products. He's constructed customized templates for standardized reports.
- It has removed the subjectivity from describing shop performance; there is more focus on numbers and trends.
- Trends are visible; they are able to see problems developing earlier while there's time to prevent losses.
- Having clear data stops people from saying "we can't do that" when the data shows they can.
- Conversely, the data also stops people from saying "we can do that" when the data shows they can't.
- The charts and graphs allow management to set goals based on data and tighten up performance. Goals are becoming more based on control and capability rather than on just meeting specifications.
For Delaney, a typical Saint-Gobain SQC software user, flexibility and ease-of-use are what matter most. "I just show people how to log on and navigate," Delaney says. "With QA they need almost no additional training, so we can get right to work."
From the corporate point of view, Puhl agrees, but he advises anyone purchasing a statistical software package to also consider the quality and consistency of the software company's customer support. "Whenever I call NWA I receive advice from a knowledgeable human being that already understands the issues I'm experiencing," he says. "That's invaluable."
Tool (mold) wear and changes in tooling produce some variation over time. However, these Quality Analyst charts help Saint-Gobain Containers maintain very good process capability and conformance to customer specifications.