A major cost-of-quality for packaged products such as food is overfill – also called “give-away”. Overfill is designed into the process to prevent regulatory problems such as Maximum Allowable Variance (MAV) label-weight violations. In addition, many commercial contracts include fill-weight specifications. This is especially true for ingredients vendors when product packages are used as recipe units.
The challenge is to minimize overfill while still meeting regulatory requirements. The means reducing the fill variation and moving the fill target as close to the lower specification limit as possible. This will minimize give-away and maximize profit. The proven way to reach this goal is to use SPC methods to stabilize the process and reduce variation.
When designing the process-improvement project the recommended practice is to quantify expected cost improvements. Not only does this establish benchmarks to evaluate progress, but it provides the data to calculate and demonstrate payback and ROI to justify the manpower, plant time, and equipment costs of the project.
While one can make the case on external factors such as avoiding regulatory fines and the cost of disruption of business, it is usually more persuasive to base the economic case on the cost of quality gains resulting from the process improvement
In the following example, excessive fill variation is caused by two problems:
- The filler was intentionally set up to overfill to avoid underweight packages and the associated regulatory issues;
- The process was unpredictable with excessive variation, so in spite of intentional overfilling, some packages were still filled below label weight.
Not only is there the immediately quantifiable loss due to giveaway, but the company still risks regulatory and contract problems with potentially large liabilities. In the case of MAV violations, the processor is exposed to substantial fines and the larger expenses of product recall, supermarket slotting fees, etc.
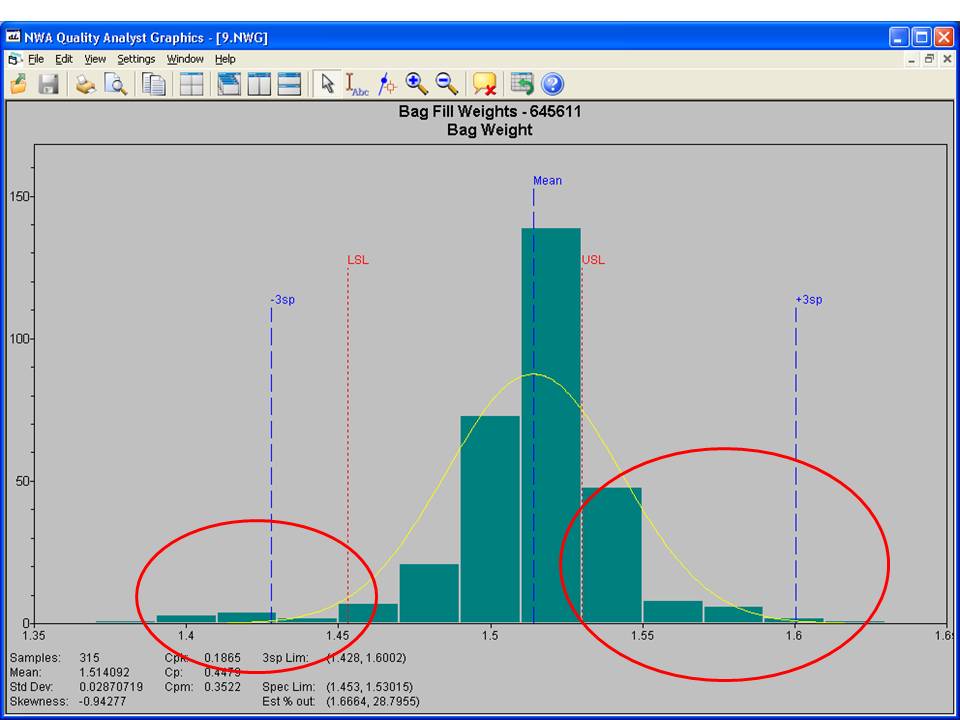 The histogram of the initial process data clearly shows both the overfill and underfill issues and calculates that a total of 30.5% of production will fall out of specification. Twenty eight percent of the production will be over the upper specification.
Counts from the histogram calculate overfill cost at $15.20 per 315 units or $0.048 per package. The estimated distribution calculates overfill cost at $21.30 per 315 units or $0.067per package. The distribution values are a better predictor of long term costs and can be effectively used for the economic justification of the improvement project. The following calculations use both values to bracket the expected range of costs.
 The control chart monitors process stability and allows one to drill down on out-of-control points to retrieve the associated descriptive information. This control chart indicates there are several opportunities to reduce variation if causes can be identified.
With the calculated savings per line ranging from $280,000 to $440,000, the quality department should easily be able to justify any reasonable process improvement project and make a substantial contribution to the company bottom line.
Estimated cost savings
| Overfill cost per 8 hour shift based on 12,000 units | Cost estimated from $0.048/package to $0.067/package |
| Estimated original overfill cost per shift | $576 - $804 |
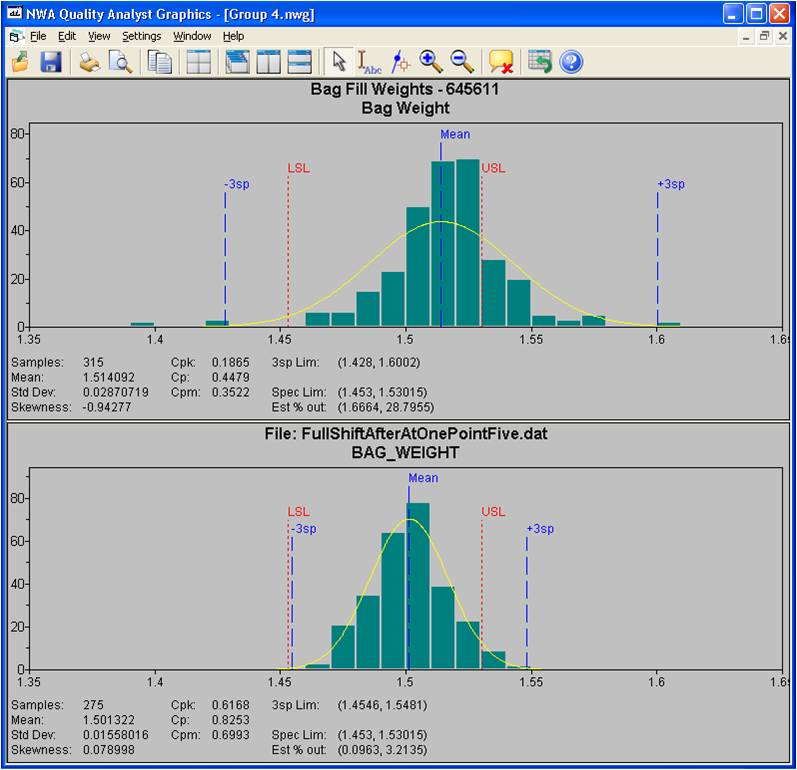
| Overfill cost per shift after process improvements | $337 |
| Final overfill cost per shift after adjusting to target | $34 |
| Total savings per shift | $542 - $770 |
| Total savings per year | $280,000 - $440,000 |