To compete in today’s global markets, manufacturers need to actively use modern manufacturing operations management systems. These systems, in turn, depend on enterprise manufacturing intelligence (EMI) which extends process based analytics throughout company operations.
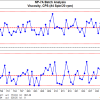
 The power implicit in analytics such as control charts reveals a different understanding of the data than conventional business analytics. The charts give staff a time-series based perspective that includes both a sense of historical behavior and the ability to predict future performance (figure 1).
However, as the application expands throughout the company, EMI comes to many decision makers who have had little or no contact with a control chart. The technical and engineering staff who will configure and support this expansion can take solace in that most of the time series based data can be effectively served up with one chart – the Individuals/Moving Range (XmR) chart.
The Individuals Chart – analytics that meets process and personnel needs.
Not only is the Individuals Chart an excellent fit with most corporate data, it is easy to properly configure and as straightforward as possible to train staff to use it properly. Now someone in logistics can be as quickly alerted to a disturbance in a supply chain Key Performance Indicator (KPI) as a process engineer monitoring a reactor with a control system.
This analysis develops insight into process behavior and supports analytics-based decision making at each point in the process. Chart based analytics are uniquely capable of separating useful process information from the noise and alerting staff when the process misbehaves. The most useful analytics exhibit the following characteristics:
- Robust, able to successfully deal with a wide variety of data coming from multiple sources thus reducing both initial and ongoing overhead from the statistical consultants.
- Simple to configure, deploy and maintain to reduce overhead for everyone from IT staff to corporate end users and ideally allowing the end user to handle at least some of the configuration or reconfiguration as needed.
- Easy-to-learn and use to make process based analytics accessible and useful for as many stakeholders as possible, especially since modern software can guide users through correct interpretation and produce more productive decision making.
Historically, manufacturing process analytics was concentrated in the hands of trained quality and process engineering staff. Their analytics tool kit includes a wide variety of specialized SPC control charts which require significant sophistication to properly match to the statistical sampling and data types and structures.
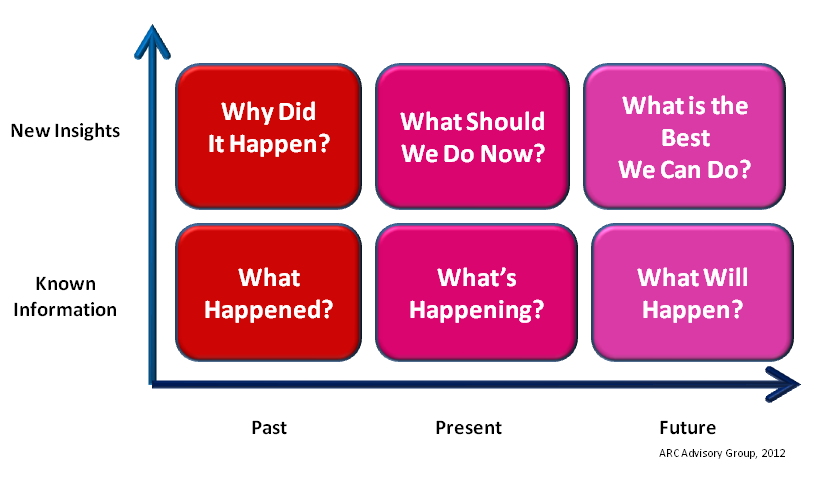
 In contrast, a major goal of EMI is to equip as many people as possible with effective decision support analytics. This implies narrowing the range of core analytics to simplify training and support for the diverse user base. The choice must also recognize that the charts will primarily deal with individual values not statistical samples and must be robust enough to deal with multiple data sources and structures. The best choice to meet these conditions is the Individuals/Moving Range chart (figure 2).
EMI Data
Process based analytics is a core EMI function where, in addition to manufacturing data, the company is extracting data of many types from a wide range of corporate functions including logistics, supply chain performance, and business transactions. Examples include:
- Control system data stored in Process Historians – Process measurements are stored as date-time stamped values. EMI provides data manipulation functions such as aggregation to make the data useful for corporate decision support. For example, the system can map a date-time stamped process parameter to a lot based laboratory analysis to enable more substantial process analysis.
- The data from the laboratory or by testing equipment is typically in the form of individual values.
- Attribute data is count based data expressed in the form of counts, rates, etc. By their very nature, these are individual data points. While there is a class of attribute control charts (p, np, u, and c), that provide valid decision support, the user must understand the statistical sampling and distribution of the data.
This adds an unnecessary level of complexity and overhead to the corporate data handling process. Plus, attribute charts require additional training for staff to use and interpret attribute charts. Since the individuals chart is not sensitive to the sampling or data distribution and provides an assumption free approach to count based data it is the better choice. - Business data – Business data is often extracted from the various corporate databases and integrated with process data to create KPIs to track important areas of business practice, e.g. sales volumes, revenues, and measures of supply chain performance such as on-time shipments. All these metrics occur as single values which indicate Individuals Charts are the analytics of choice.
As mentioned, the important argument for the Individuals Chart comes from the nature of corporate data. The EMI model dramatically extends the reach of process based analytics throughout the enterprise. For this corporate data, the Individuals Chart is the most flexible, adaptable charting method and best suited to the EMI environment because it is:
- useful for both variable and attribute data;
- appropriate for data which is not amenable to statistical subgrouping;
- less sensitive to problems related to data distributions and organization;
- an easy to explain technique that can be effectively used to provide decision support to users throughout the enterprise;
- the choice for monitoring Key Performance Indicators (KPIs).
Individuals Charts can handle all these types of data and provide useful real time decision support while avoiding needless complexity. Not only can the chart deal with the variety of data organization, but it is less sensitive to the vagaries of data distributions.
This is consistent with Walter Shewhart’s (the father of SPC) approach to solve real production problems by looking for a state of control but not evaluating specific probability distributions. The purpose of EMI is to provide useful empirical data support where statistics serve process management and not having process management subservient to statistics.
“Remember that the purpose of analysis is insight rather than numbers. The process behavior (control) chart is not concerned with creating a model for the data or whether the data fit a specific model, but rather with using data for making decisions in the real world.” Donald Wheeler
There are some voices in process based analytics that focus on the technicalities of statistical modeling and argue that “proper” process management requires a large number of specialized control charts to realize the maximum sensitivity in process monitoring. This requires substantial statistical sophistication and technical overhead to analyze the process and does not speak to the needs of supporting enterprise wide manufacturing intelligence.
The pragmatic solutions oriented approach argues for the relative simplicity of more flexible and robust charting methods such as the Individuals chart. Not only do they provide sufficient sensitivity to signals that the process is misbehaving, it is simpler to develop a wider base of competence within the organization. This better serves the overall EMI goal of more effectively managing the manufacturing enterprise.
By focusing on and mastering a select number of fundamental tools, we make it easier to develop intelligent corporate-wide decision making. This simplifies user training, support for the decision-making process and set up and support for data handling and retrieval. This approach enables all stakeholders to become capable at using process analytics for decision support and thereby winning the market.
Using Charts to Monitor KPI Performance
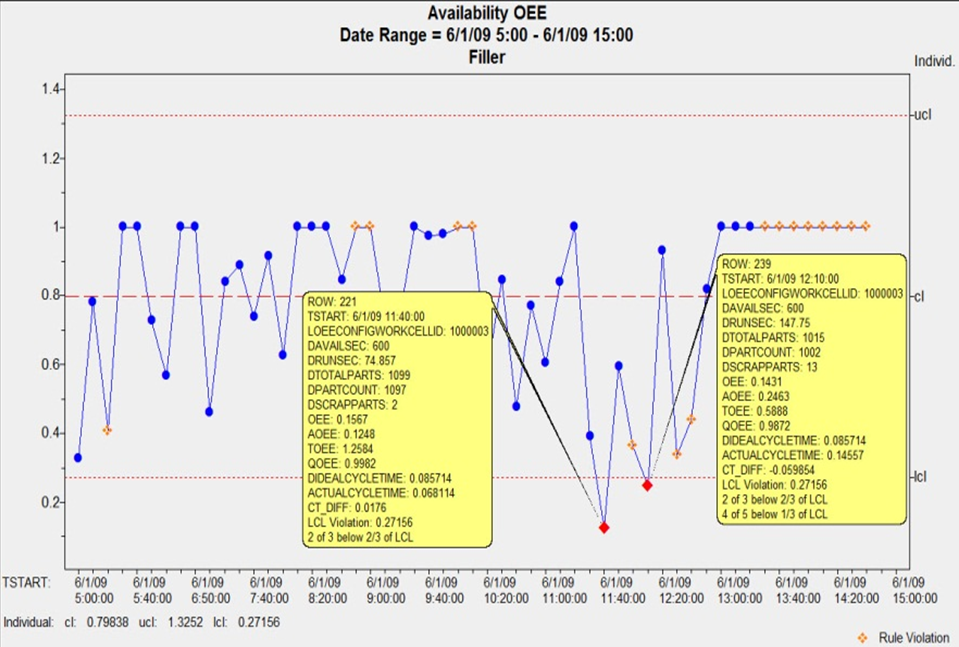
The following example of monitoring a filling line illustrates how Individuals Charts can be used to interpret the behavior of a KPI such as Overall Equipment Effectiveness (OEE) and provide real-time support for process management and improvement activities.
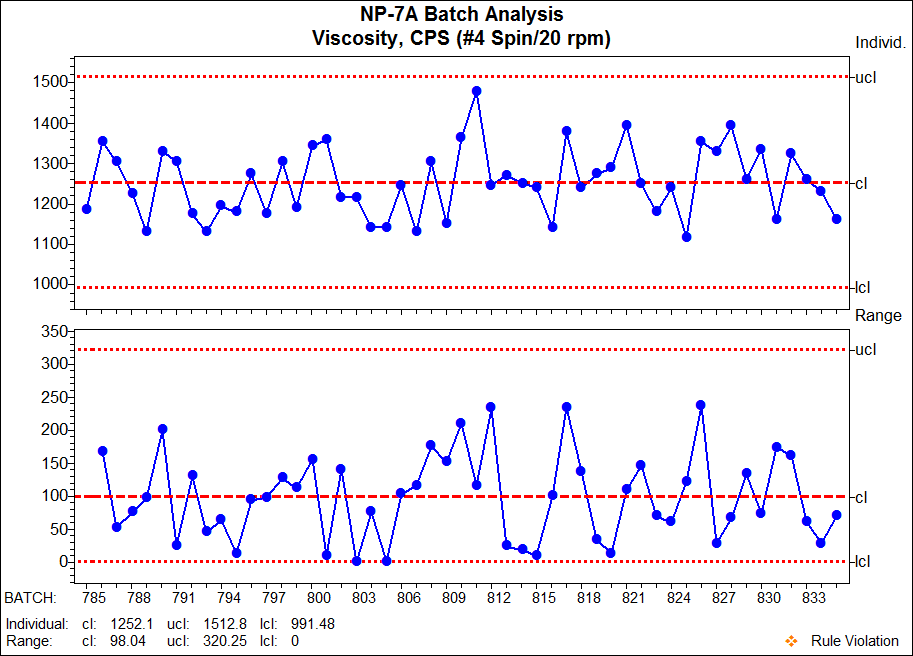
 A properly designed EMI system will enable decision makers to drill down to the individual line components such as the filler. By using Individuals Charts one can separate process signals from the noise to guide process management. In the figure below, the two points where the overall OEE is out of control are indicated by the red symbols.
The drill down displays the particular details of one of these points. Note the values for the three components of OEE:
Availability 0.2463
Throughput 0.5888
Quality 0.9872
This suggests that Availability is a major contributor to the poor OEE value followed by Throughput. To further investigate, one charts the Availability values:
By actively using the charts, the filler performance can be examined to determine the special causes of the poor Availability values, help bring Availability under control, and increase the process capability of the filler.
This brief overview indicates what is possible by using charts to monitor KPIs such as OEE. For a more comprehensive discussion of this case study, read the white paper, Applying Manufacturing Intelligence to OEE for Real-Time Decision Support. Additional Reading: Donald J. Wheeler, Understanding Variation – The Key to Managing Chaos, 2000, SPC Press