Best-in-class manufacturing requires complete real-time process performance monitoring and the analytical decision support for process management and improvement. The impact of such an approach is profound as indicated in two recent MESA studies (MESA 2012a, MESA 2012b).
Performance management is all about how an organization measures and improves performance over time. Key Performance Indicators (KPIs) are business performance metrics which are designed to evaluate and visualize specific operations within the organization, the purpose of which is to focus on the most important measures that characterize the business.
KPIs are created to give a more complete understanding of process performance. A KPI integrates one or more pieces of data into a value that enables better understanding of how performance goals are being met. Properly designed, they simplify quicker understanding of process status.
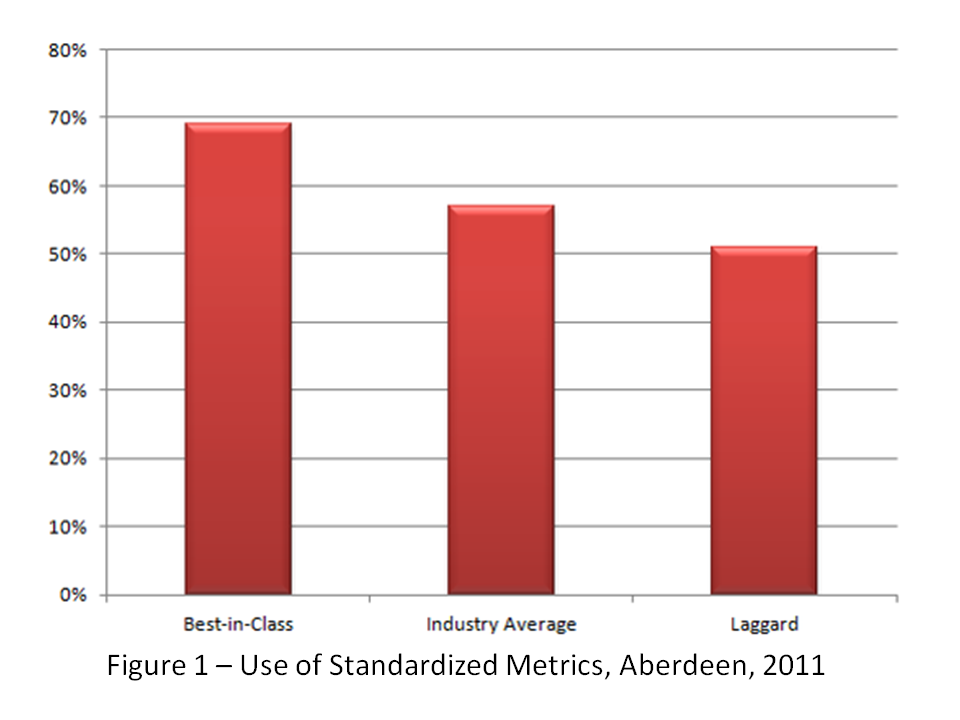 A critical capability that best-in-class companies are leveraging is standardized KPIs. Those manufacturers boast a 40% higher rate of standardized metrics than laggard manufacturers (figure 1).
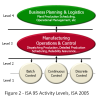
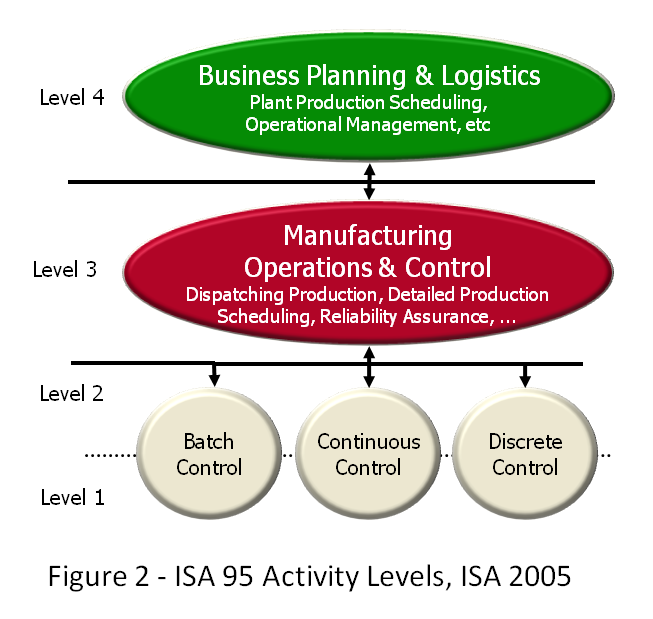 Those performance gains are further benefited from the application of standard industry reference models like ISA 95 to the components and the linkages needed to make a suitable manufacturing enterprise data system (figure 2).
And as data is combined from multiple sources, as it is with manufacturing intelligence (MI) solutions, it can be given a new structure or context that will help users find what they need regardless of where it came from.
The primary goal is to turn large amounts of manufacturing data into real knowledge and drive business results based on that knowledge. As the MESA studies show:
- Use of MI yields larger increases in profit and quality;
- Aligning metrics across the organization develops more productive management at all levels;
- Clear definition of the metrics and understanding the source data ensures accuracy and buy-in for the results from all departments.
A major factor in the demonstrated success of MI is that it enables the process-based view of manufacturing. All manufacturing occurs within a process, and statistical methods are the tool-of-choice to understand and manage the process.
Any single value of a metric by itself is only a snapshot with no sense of past or future behavior. MI and a process view integrate past performance with the current value and deliver a defensible prediction of future behavior. This forms the basis of truly useful manufacturing decision support.
MI incorporates the methods of statistical process control (SPC) and process capability analysis which have been recognized as the most effective way to understand and deal with process behavior. SPC is one of the foundational techniques for TQM and Six Sigma programs and a core competence for process management and improvement.
The isolated metric provides only a small amount of decision support. The single value can be compared to a specification, but it does not provide any indication of previous process behavior and what are reasonable expectations for future performance. When put into context with SPC, that same metric value delivers substantially greater process management information.
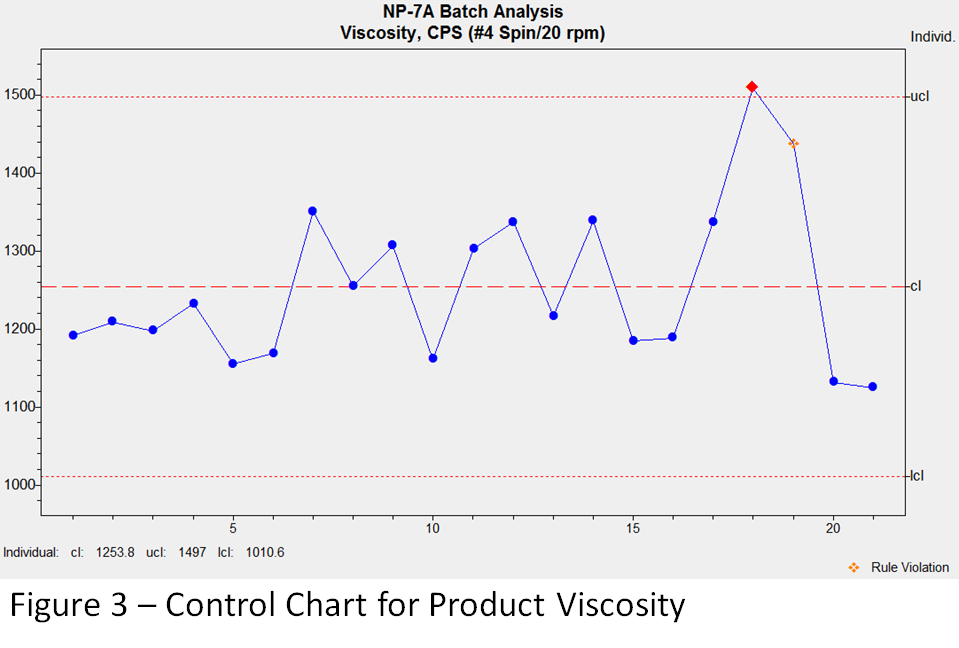 For example, if a batch viscosity is measured at 1509 and the specification is 1600, engineering could assume all is well and feed the product into the filler with no concern. However, when that same value is plotted on a control chart (figure 3) it is immediately apparent that value is out of control and alerts staff to examine the process stability.
Increasing the operational value of metrics with analytics is core to the MI impact on process management. The MI synthesis of quality data collection, process based analytics and timely delivery of role specific information has a demonstrated positive impact on corporate performance. This was confirmed in the MESA studies, “Throughout the MESA Metrics research series, speed of the process to collect, analyze, and display the data has been a clear differentiator for those who improve their business results (MESA, 2012a)”.
MI integrates data from multiple process management and business sources and applies analytics to provide a comprehensive actionable view. By developing “One Version of the Truth”, improving communications, and delivering real-time decision support, the organization better understands the relationships and impact of one variable or metric on another and how to optimize production accordingly. MI ultimately results in increased process performance including higher throughput and quality.
The Value of OEE as a KPI
The drive to reduce waste and improve performance has led well run companies to aggressively use Overall Equipment Effectiveness (OEE) to monitor performance. OEE is a KPI that combines measures of availability, throughput and quality. This provides a more complete evaluation of the performance of a piece of equipment or production line.
Although it is used and understood in many industries, OEE, like many metrics, is often treated as an isolated value and not as a process parameter with variation and trends. The shift to process based thinking enables management and staff to develop a more sophisticated understanding and manage the process at a higher performance level. By applying process analytics such as SPC the company derives the maximum decision support and business return from using the OEE KPI.
OEE is defined as OEE = Availability X Throughput X Quality. Each individual OEE component is defined as:
Availability = Running Time/Available Time
Throughput = Total Units X Ideal Cycle Time/Running Time
Quality = Good Units/Total Units
OEE provides rich insights into manufacturing performance and when coupled with analytics such as SPC enables one to reduce manufacturing costs by getting more production out of existing facilities. Management can identify problems quickly and, most importantly, make decisions based on facts not assumptions.
Not only does this improve the return on assets, it functionally increases capacity without requiring new assets. Even small improvements in OEE scores can produce substantial improvements in efficiency and profitability and deliver good ROI for the process monitoring and improvement effort.
When properly deployed with SPC, OEE will:
- Identify Problems Quickly
- Reduce Manufacturing Costs
- Improve Return On Assets
- Increase Capacity without New Assets
- Focus Capital spending for maximum return
 Not surprisingly, the studies found the levels of OEE deployment highest among the best business performers (figure 4).
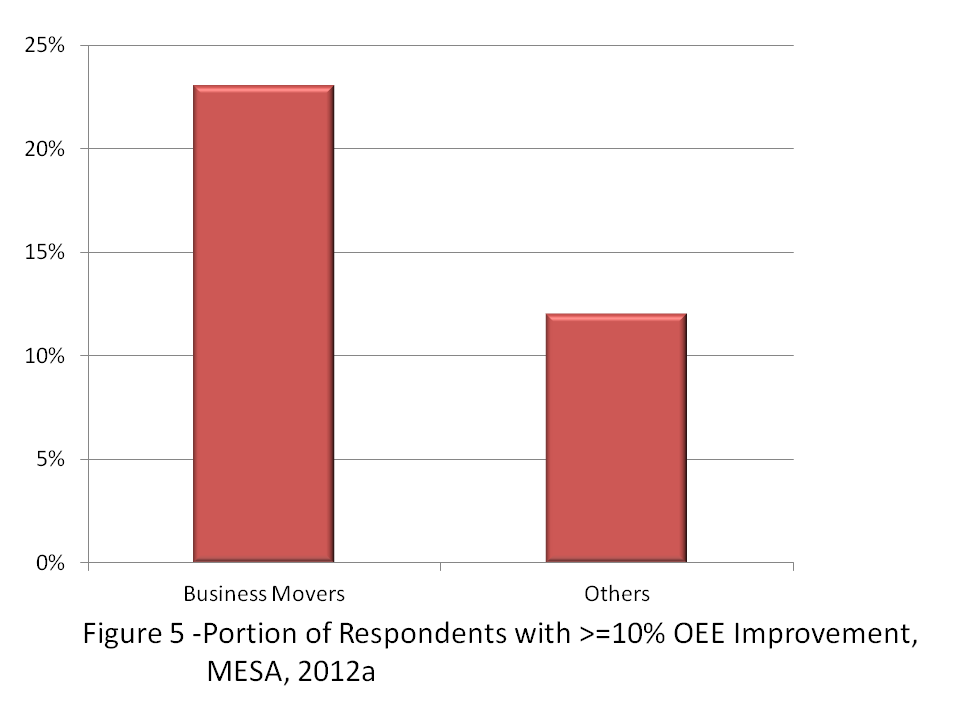 The MESA studies also identified that the most profitable companies as those who were most successful in improving OEE values in their plants (figure 5).
Increasing the Value of OEE with SPC
By using SPC and treating OEE like any other process parameter, more value is extracted from the monitoring process and provides more effective operational decision support. With statistically based trend analysis one can quickly identify areas having problems in quality, throughput or availability. SPC-based alerts enable personnel to proactively use predictive trends in operational data to maintain process stability and increase the capability to meet specifications.
Using a content-rich metric such as OEE indicates more mature manufacturing operations management. Using SPC and treating the OEE metric as a continuous variable embedded within a system represents a further advanced understanding of manufacturing process management.
More value can be extracted from the monitoring process by using SPC and treating the OEE KPI as a process parameter. The most common benefits include the ability to:
- Quickly identify areas having difficulties in either quality, throughput or availability
- Perform detailed statistical analysis on automated data collection systems
- Alert personnel to predictive trends in operational data
The staff can do this effectively because the systems support integrated quality/operations management. Further by using SPC to monitor the OEE KPI they can also drill down to the behavior of the individual KPI constituents, availability, throughput and quality.
Applying SPC to OEE for Bottom-line Results
A leading manufacturer ascribed to this approach and leveraged Northwest Analytics solutions to generate bottom-line savings, using OEE to monitor and improve performance of a filling line. It illustrates how SPC can be used to interpret the meaning of OEE values and direct process management and improvement.
The filler line has six components:
- Depalletizer
- Feeder
- Filler
- Labeler
- Case Packer
- Palletizer

Each component is monitored by automated data collection systems. The data is stored in centrally accessible databases with known and compatible data structures including consistent variable naming.
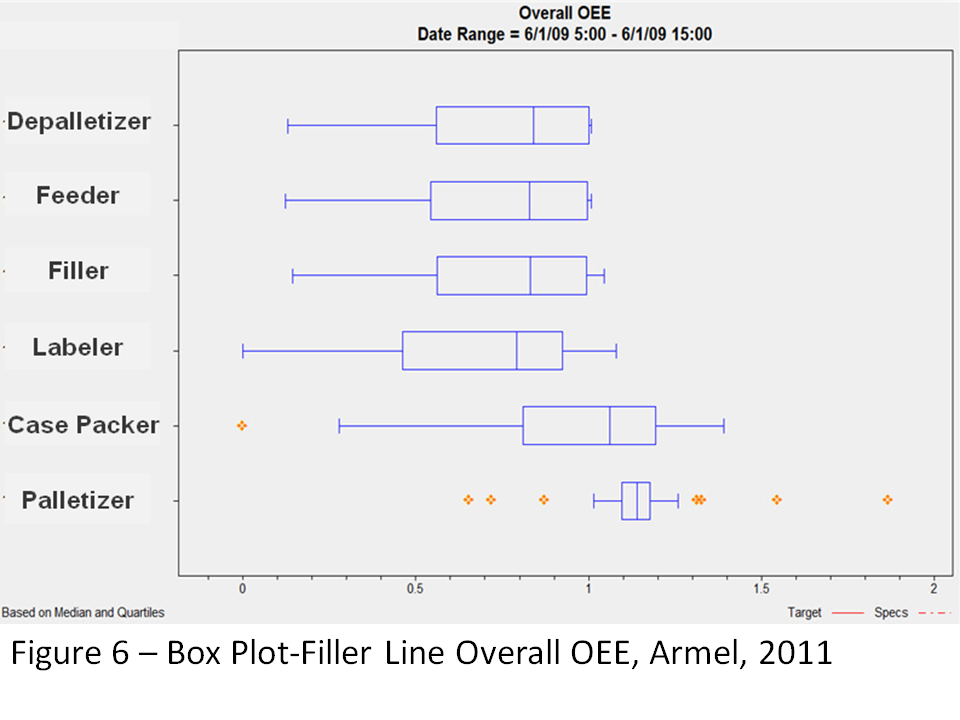 This manufacturing-intelligence strategy enables straightforward process monitoring and alerts. For example, in figure 6, box plots display overall OEE for all the filling line components. This level of transparency supports complete process awareness and the ability to look for any suspicious process variation that requires attention.
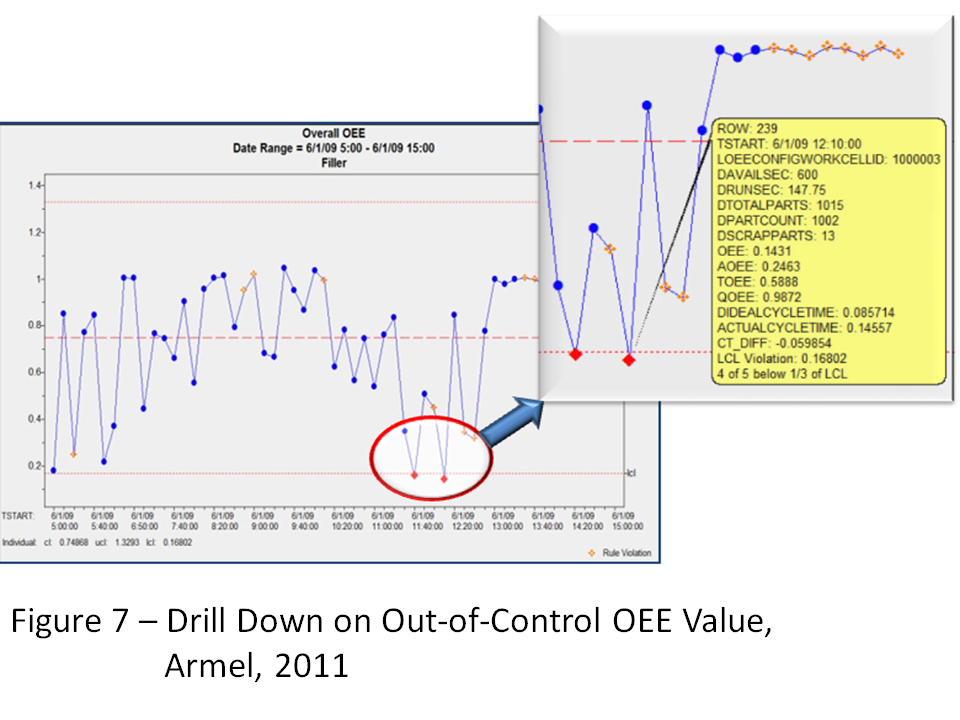 MI systems enable decision makers to drill down to the individual filling line components such as the filler. By using SPC control charts one can separate process signals from the noise to guide process management. In figure 7 the two points where the overall OEE is out of control are indicated by the red symbols. The drill down displays all the descriptive information concerning one of the points.
Note the values for the three components of OEE:
Availability 24.63%
Throughput 58.88%
Quality 98.72%
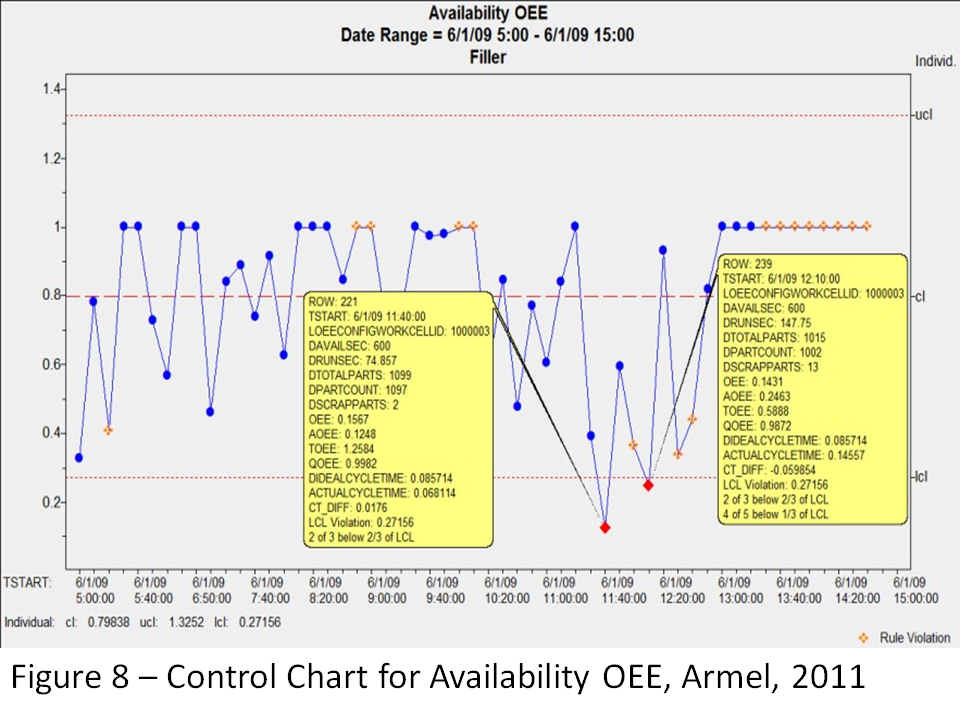 It is clear that availability is a major contributor to the poor OEE value followed by throughput. One then plots the control chart for Availability (figure 8).
Using SPC methods one can dissect the filler performance and work on determining the special causes of the poor availability values, begin to bring availability under control, and work to increase the process capability of the system.
The complete discussion of this case study can be found in Armel, 2011, “Improving Packaging Line Performance with OEE and SPC”.
Summary
Good practice standardizes parameters and metrics across the entire operation to enable meaningful manufacturing decision support and continuous improvement. Frequently manufacturing and business parameters are combined into Key Performance Indicators (KPI) to simplify monitoring more complex functions. One commonly deployed KPI is Overall Equipment Effectiveness (OEE) which combines measures of availability, throughput and quality.
There exists tremendous value potential for companies coupling OEE with SPC, and making it part of manufacturing-decision support. It sets the company on the path to state-of-the-art manufacturing process management by enabling them to:
- Apply SPC to automated OEE solutions – looking at single values of a KPI adds little to one’s process management capability, but using control charts and process capability analysis will enable developing world-class manufacturing;
- Rapidly determine where improvement opportunities exist;
- Focus oninformation, not data – data is the raw material; information provides the decision support that will improve performance levels.
References:
Aberdeen Group, 2011, Operational Intelligence, Aligning Plant and Corporate IT
Armel, 2011, “Improving Packaging Line Performance with OEE and SPC”
ISA, 2005, Enterprise Control System Integration Part 3: Activity Models of Manufacturing Operations Management ANSI/ISA—95.00.03—2005
MESA, 2012a, Performance Improvement and Metrics Practices, White Paper #40, 2/12/12
MESA, 2012b, Pursuit of Performance Excellence: Business Success through Effective Plant Operations Metrics