 Defect problems in complex assemblies are a major headache for both quality staff and management. Not only can the line have unacceptably poor yield due to rejected assemblies, high rework costs threaten profitability of the operation. Low yield can also lead to delayed or missed shipments which will threaten the company status as a vendor, especially in JIT supply chains.
In this example, quality checks for the assembly reveal significant defect problems which produce rejected assemblies and rework instead of shippable product. Quality engineering can estimate the total cost of poor quality by looking at scrap and rework to provide a first pass estimate of the scope of the problem.
While it is easy to quantify the overall costs, this step will not characterize the particular defects and their relative importance. Often, at the beginning of a project, the overall nature of the defects is poorly understood. A structured approach is required to identify and focus on the right issues.
An important first step is to implement an organized and structured data collection system. This will reduce variation in the data collection process itself and produce more dependable data. A good plant floor system will enforce Standard Operating Procedures (SOP) and minimize workflow interruption and produce better results.
Collecting data in an organized fashion simplifies the analytical and problem solving process. This front end investment will pay substantial dividends in both lower operational costs and better results.
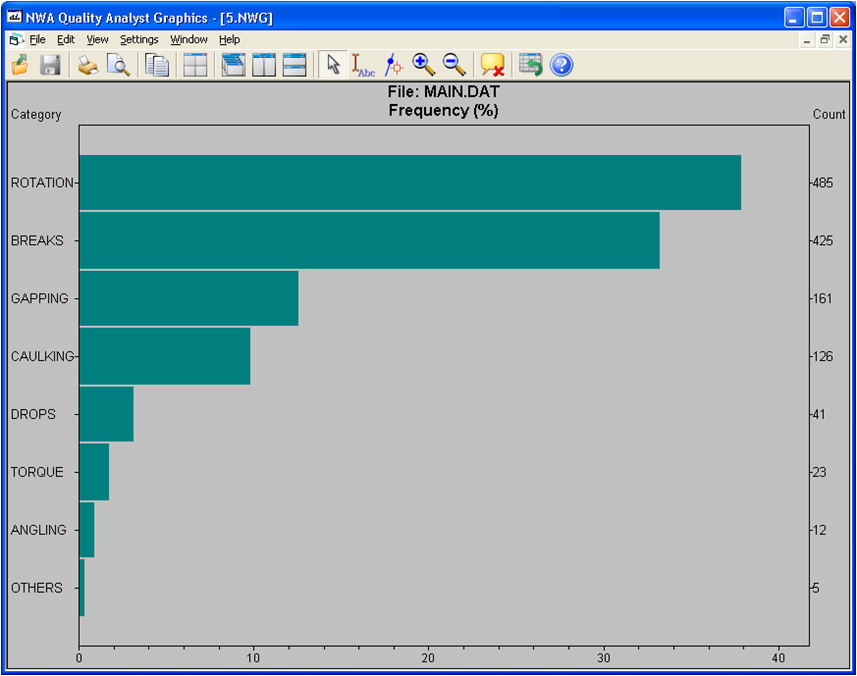
After the data has been collected, the counts of the various defects are often ranked with Pareto analysis. While this gives a first pass ranking, there is limited information on the financial and operational impact of each defect category.
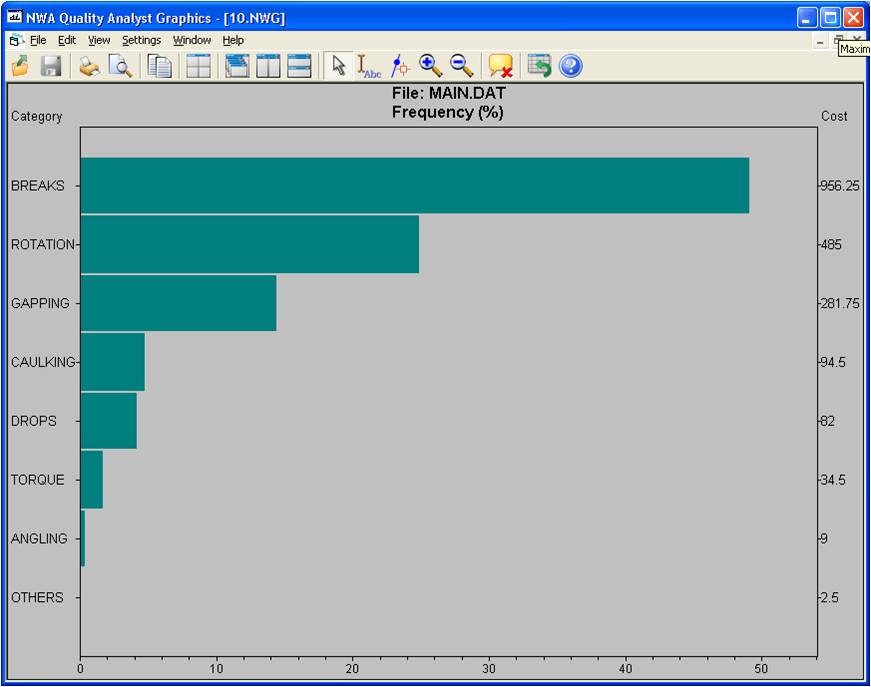
Pareto charts that weight the defects by cost provide more actionable information on where the financial and operational impacts are. As shown in figure 2, ‘Breaks’ and ‘Rotation’ are the two most costly defects and should be given priority for further study.
Just knowing what problem is most common or most costly does not by itself provide insight into which defects are amenable to process improvement. The quality staff must turn to SPC control charts to decide which defects can be successfully corrected by process improvement methods.
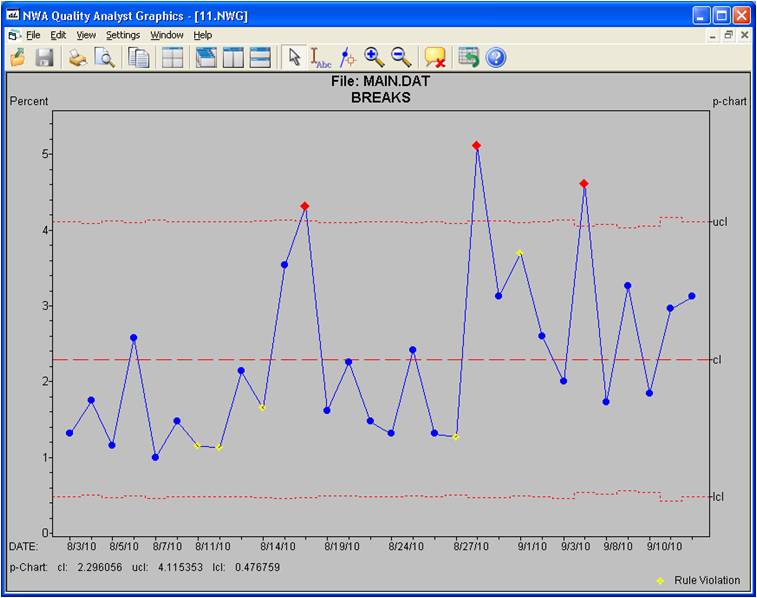
The control charts for ‘breaks’ and ‘rotation’ show the behavior of the two defect classes. 'Breaks' shows many samples with unusually high defect rates. Since this process is clearly out of statistical control it is a good candidate for process improvement methods. It should be possible to identify the specific cause or causes by examining information about the process when the unusually high defect levels occurred.
However, the rate of ‘Rotation’ defects is in perfect statistical control. This means that the process is essentially designed to produce this level of defects and there is no value in looking at high and low points for causes. A reduction in 'Rotation' defects can only be achieved by changing the process itself.
The use of appropriate analytics (SPC in this case) shows that solving the yield problem for this product will require two very different initiatives.
Estimating the cost of quality savings based on sample results and SPC analysis
The cost-weighted Pareto analysis estimates the cost of the Rotation and Breaks defects of the 10% sample taken over three months at $14,410. The total cost of poor quality for all production will therefore be $144,100 per quarter.
In this case, finding the cause of the 'Breaks' problem added tothe quality engineer's understanding of how the process causes "Rotation defects suggests the defect rate can be reasonably reduced by 35%. If they reach the 35% target, the total savings will be $50,435 per quarter or $201,740 annually.
Determining actual savings will require good initial studies to establish the cost baseline and focused use of SPC throughout the improvement process. With an estimated savings per line greater than $200,000, the quality department should be able to justify any reasonable process improvement project and in the process make a substantial contribution to the company bottom line.