World class manufacturing requires real-time monitoring and analytical decision support for process management and improvement. As part of this effort Key Performance Indicators (KPI) are often used to focus on the most important measures characterizing the business. Unfortunately, many companies use KPIs as isolated values without analytics and set themselves up for bad decisions.
Recent studies from MESA show SPC-based analytics coupled with KPIs make some of the most effective manufacturing process management tools. Overall Equipment Efficiency (OEE) is a widely recognized KPI that provides a high level overall appraisal of operational performance.
OEE incorporates measures of machine or system availability, throughput and quality into a KPI that can be monitored for alarming and analyzed with process based analytics such as SPC. OEE is defined as
OEE = Availability X Throughput X Quality
Each individual OEE component is defined as:
Availability = Running Time/Available Time
Throughput = Total Units X Ideal Cycle Time/Running Time
Quality = Good Units/Total Units
OEE provides rich insights into manufacturing performance and reduces manufacturing costs by getting more production out of existing facilities. Management can identify problems quickly and very importantly, make decisions based on facts not assumptions.
Not only does this improve the return on assets, it functionally increases capacity without requiring new assets. Even a small improvement in OEE scores can produce substantial improvements in efficiency and profitability and deliver a good ROI for the process monitoring and improvement effort.
Automated data collection and real-time OEE
Incorporating KPIs such as OEE into a management system is a strong argument to move from manual to automated data collection. Not only is paper-based data collection labor and time intensive, but it is error prone and the data is not easily available for timely process correction and improvement. For example, on-line, real-time data collection by control systems can capture data such as short duration stoppages, precise event duration and accurate unit counts. This is not feasible with paper-based manual systems.
For at-process data collection the Quality Information System uses automated data collection stations for better accuracy and data integrity than paper on a clipboard. The QIS data collection handles processes such as container fill monitoring and grab sampling for at-line testing.
Systems that provide integrated access to the databases coupled with analytics convert process data into actionable information. This scale of process data handling, analytics and reporting is part of what is often called Manufacturing Intelligence (MI). Since people make decisions based on information not raw data, the MI capability is critical to developing world class process management.
Automated real-time systems make information available immediately. In addition to being timely, the information must be actionable so that process engineering can meaningfully work on process improvement. Generally, old information is less actionable since reacting to yesterday morning’s data does not solve today’s problem. MI is designed to reinforce the right operational behavior.
With the right data management, analytics, and reporting, the system can deliver role-specific analytics to each person working on the system be they line operators or management. Web- and network-based reporting coupled with drill down capabilities has a much greater total impact on effective process management than is possible with manual paper-based systems.
Benefits of applying SPC to OEE data
An isolated OEE value provides only a small amount of decision support. The single value can be compared to a specification, but it does not provide any indication of previous process behavior and reasonable expectations for future performance. When put into context with SPC, that same OEE delivers substantially greater process management information.
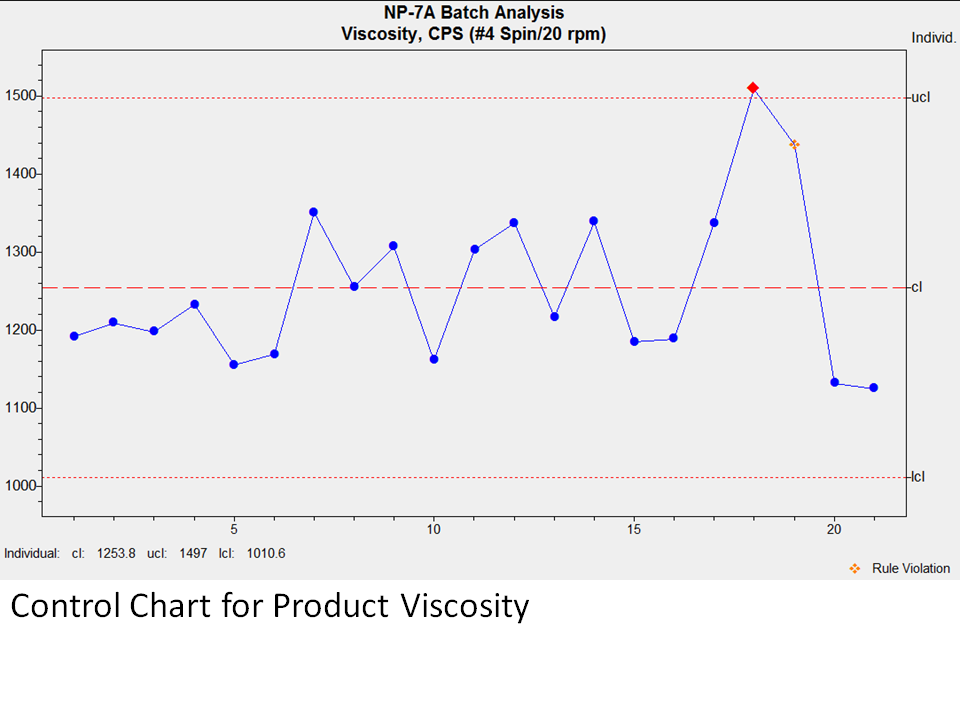 For example, if a batch viscosity is measured at 1509 and the specification is 1600, Engineering could assume all is well and feed the product into the filler with no concern. However, when that same value is plotted on a control chart (Figure 1) it is immediately apparent that it is out of control and alerts staff to examine the process stability.
More value can be extracted from the monitoring process by using SPC to treat OEE as a process parameter. The most common benefits include the ability to:
- Quickly identify areas having difficulties in either quality, throughput or availability
- Perform detailed statistical analysis on automated data collection systems
- Alert personnel to predictive trends in operational data.
Filling Line Example
The following example of monitoring a filling line illustrates how SPC can be used to interpret the meaning of OEE values and direct process management and improvement. The filler line has the following six components:
- Depalletizer
- Feeder
- Filler
- Labeler
- Case Packer
- Palletizer

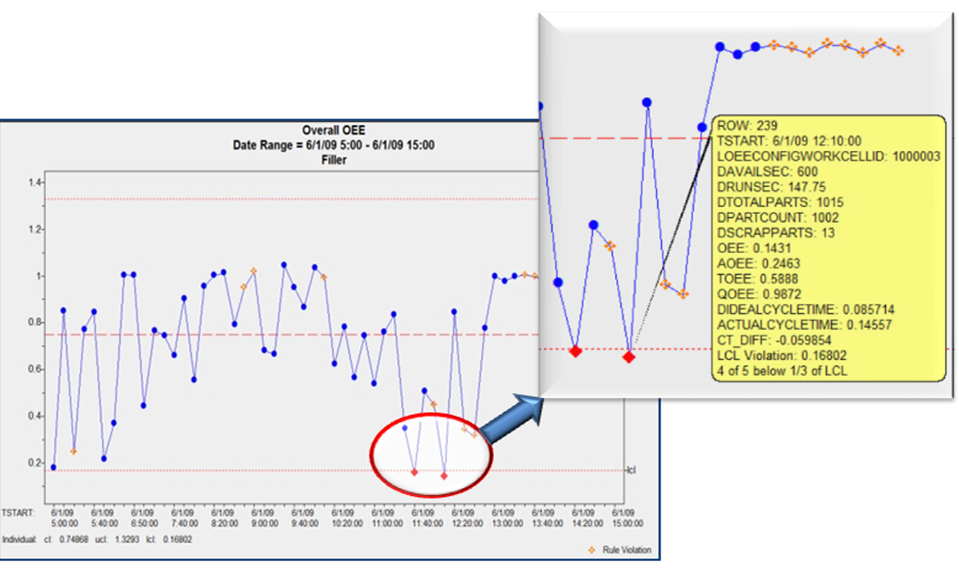 MI systems enable decision makers to drill down to the individual line components such as the filler. By using SPC control charts one can separate process signals from the noise to guide process management. In Figure 2, the two points where the overall OEE is out of control are indicated by the red symbols. The drill down displays all the descriptive information concerning one of the points.
The drill down displays the particular details of one of these points. Note the values for the three components of OEE:
Availability 0.2463
Throughput 0.5888
Quality 0.9872
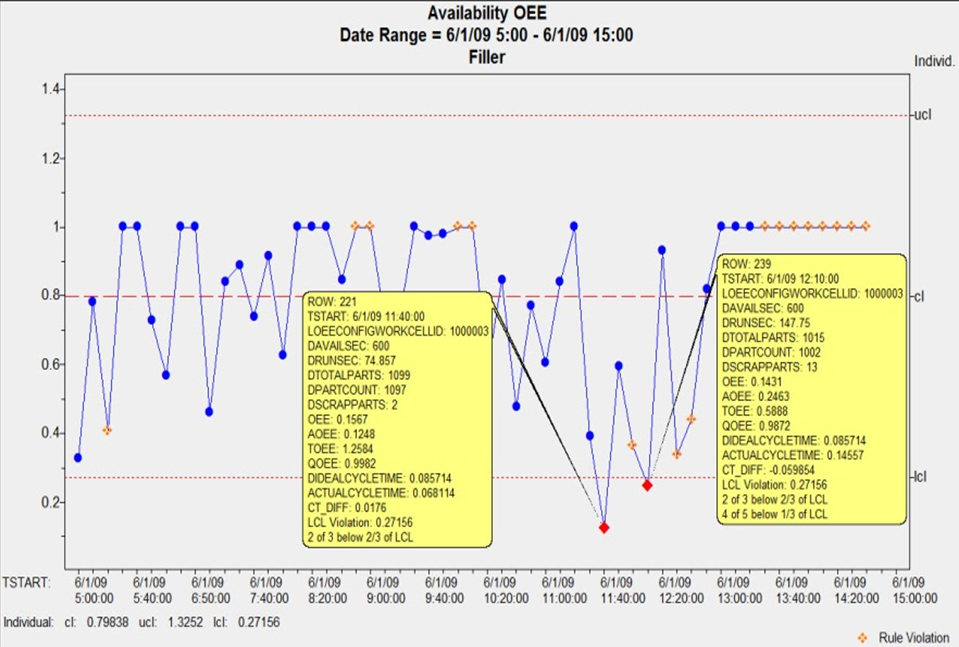 It is clear that availability is a major contributor to the poor OEE value followed by throughput. One then plots the control chart for Availability as in Figure 3.
By using SPC methods one can dissect the filler performance and work on determining the special causes of the poor availability values, begin to bring availability under control, and work to increase the process capability of the system.
This brief overview provides an indication of what is possible by using SPC with OEE. For the complete discussion of this case study, view the recorded webinar, “Improving Packaging Line Performance with OEE and SPC”.
Summary
Good practice standardizes parameters and metrics across the entire operation to enable meaningful manufacturing decision support and continuous improvement. Frequently, manufacturing and business parameters are combined into KPIs to simplify monitoring more complex functions. One commonly deployed KPI is OEE which combines measures of availability, throughput and quality.
There exists tremendous value potential for companies coupling OEE with SPC and making it part of manufacturing-decision support. It sets the company on the path to state-of-the-art manufacturing process management by enabling them to:
- Apply SPC to automated OEE solutions – looking at single values of a KPI adds little to one’s process management capability, but using control charts and process capability analysis will enable world-class manufacturing;
- Rapidly determine where improvement opportunities exist;
- Focus on information, not data – data is the raw material; information provides the decision support that will improve performance levels.