Revised: April 1998
formerly "Statistical Quality Control and Printed Circuit Board Manufacturing"
The need for Statistical Quality Control (SQC) in the manufacture of electronic components is well accepted. Not only does SQC allow firms to comply with vendor-certification programs, it is essential for maximizing yields, minimizing rework, and increasing profits. This paper describes the application of NWA Quality Analyst to quality control in the assembly of electronic components. The examples used here are composites of several NWA Quality Analyst users in the manufacture of electronic components.
SPC Charting with NWA Software
Many electronics-assembly operations use process-capability analysis to select, optimize, and certify production equipment. Once the system is established, variable and defect tracking monitors the daily production. If control charting reveals serious problems, an engineering study can reveal the sources of the problems.
Manually produced control charts can track manufacturing processes acceptably, but collecting and charting the data disrupts the production process while putting extra burdens on assembly and inspection staff. Also, manual collection and charting do not directly integrate into vendor and in-house reporting systems; data retrieval over any length of time is at best awkward.
Spreadsheet-based charting improves on manual methods, but requires considerable up-front configuration and macro building. Maintaining macros requires an ongoing input of skilled labor and time. Adapting to changes in charting methods or requirements is expensive and time-consuming.
The alternative is to use SQC software such as NWA Quality Analyst and its companion plant-floor data-collection software, NWA Quality Monitor. For considerably less investment of time and money, the plant can collect data from the assembly operation and produce accurate control charts while minimizing training time and interference with production.
Variable Measurement with X-Bar/Range Charting
In the following example, a Printed Circuit Board (PCB) manufacturer tracks solder height with NWA Quality Analyst. Keeping solder height within control limits is critical in PCB manufacturing because solder height determines how well components will sit on the board, and therefore, how well they will operate as designed. Also, if the boards are stored or stacked, the solder height determines whether copper in the components will migrate, causing the boards to become defective.
Inadequate solder height can indicate many problems including wear and tear on the solder stencil, a calibration problem with the machine applying the solder, inadequate stencil cleaning, or a raw material problem. Any of these problems can lead to higher production costs due to waste or rework.
In this example, the specification for the solder height is 0.25-0.55 mm. Periodically, samples of five units made at the same time are measured for solder height. This data is analyzed with NWA Quality Analyst using X-Bar/ Range Charting to determine whether the height variation indicates an out-of-control condition. The Quality Control staff member knows that a certain amount of variation is natural to the process, but an out-of-control condition could indicate a problem that, if left unresolved, could become very costly to the plant downstream.
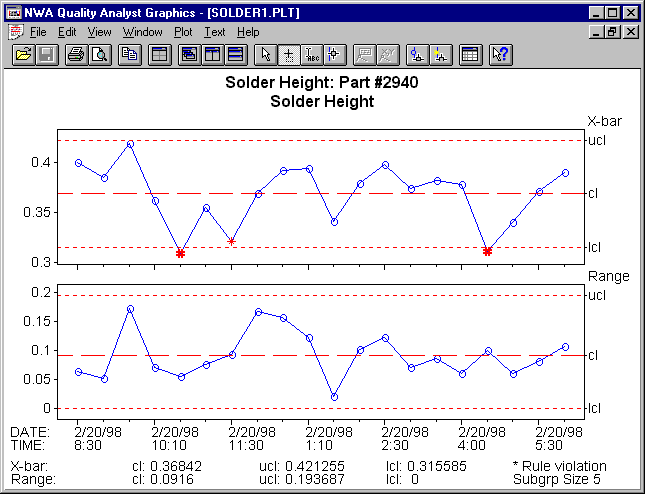 Data from a full day's run is charted in an X-bar/Range chart (see Figure 1). This chart shows that the process is out of control on the X-Bar chart, but in control on the Range chart. This indicates that the process average is being influenced by something external to the process.
The X-Bar chart in Figure 1 shows a process is providing an average solder height in each sample that varies greatly from sample to sample. Figure 1 also shows that two samples are out of control.
The external cause results in inadequate solder height. The problem might be with the raw material, with the machine applying the solder, or even with the measuring device itself. Upon investigating the records, the process engineers found that the inadequate solder heights all came from lots using raw materials from a single vendor. Further analysis of lots from that vendor revealed the vendor's inability to produce consistent material. As a result, the manufacturer dropped the vendor as a supplier.
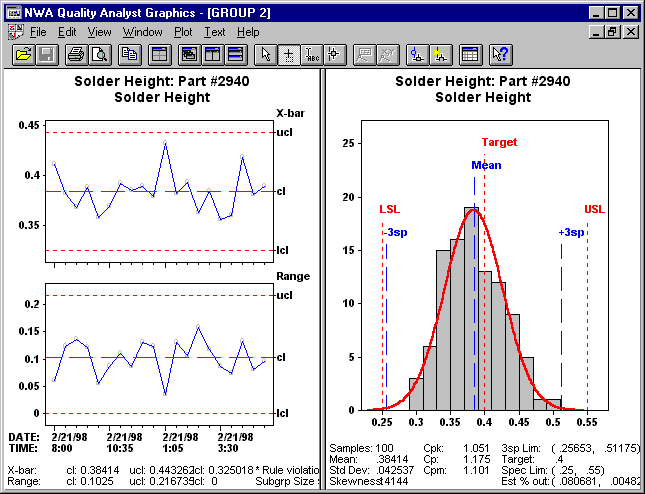 With the out-of-control condition removed, the process engineers analyzed the process further. The process was run and charted for another day using only raw materials from reliable vendors. The process was now in control (Figure 2) but suffered from excessive variation and was not capable of producing output well within specifications. (Note the Cpk of 1.05). Such a situation indicates significant opportunities for process improvement because the in-control condition indicates that the source of the excessive variation is the process itself.
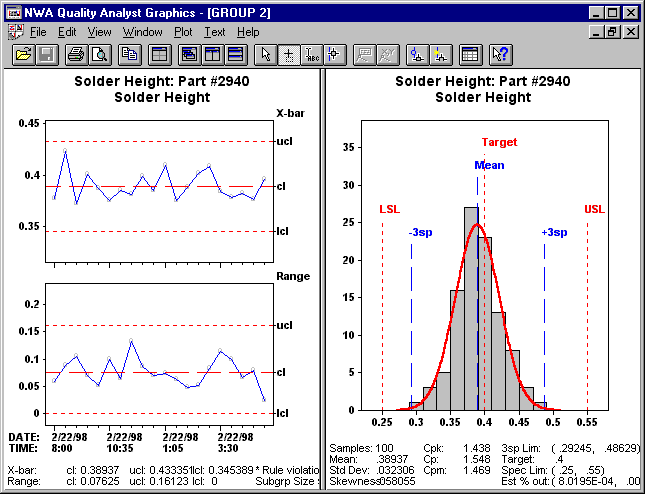 In this particular case, the process engineering team discovered that the machine needed maintenance and recalibration. This was done and the results for the next day's production (shown in Figure 3) indicate a process in control and capable of producing output well within specifications. (Note the Cpk of 1.438).
Defect Tracking with Pareto Diagrams
After the board has been assembled, the PCB manufacturer uses Pareto Analysis to examine the relative contribution of different defects that lead to PCB rejects. One advantage to SQC software is that the user can easily examine the data from different perspectives with minimal time and effort. With NWA Quality Analyst, the user also has complete control over labeling, individual defect percent, cumulative frequency, and so on.
Pareto analysis offers an excellent example of how NWA Quality Analyst delivers improved capability for considerably less effort. In our example of the PCB manufacturer, the plant uses Pareto analysis to track defects arising from the following solder-related attributes:
- Insufficient Solder
- Excess Solder
- Cold Solder
- Shorts/Bridges
- Solder splash/ball Flags (peaks)
- Open joints
- Pinholes/voids
- Other—Miscellaneous solder problems
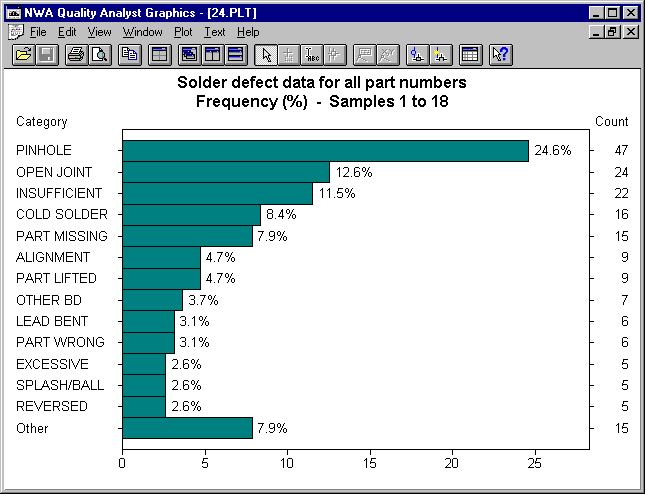 Pareto diagrams are commonly used to rank the relative frequency of different categories of defects. With a Pareto diagram, the quality control staff can assess the relative contribution of different defects to PCB rejects and assign priorities for addressing their causes. (See Figure 4.)
For example, when using Pareto analysis, it is often useful to rerank defects by categories other than frequency of occurrence. One alternative ranking is cost. Reranking requires only a few mouse clicks in NWA Quality Analyst.
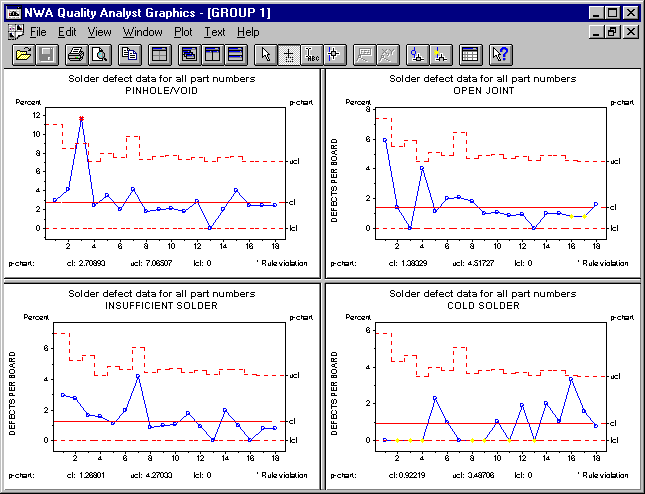
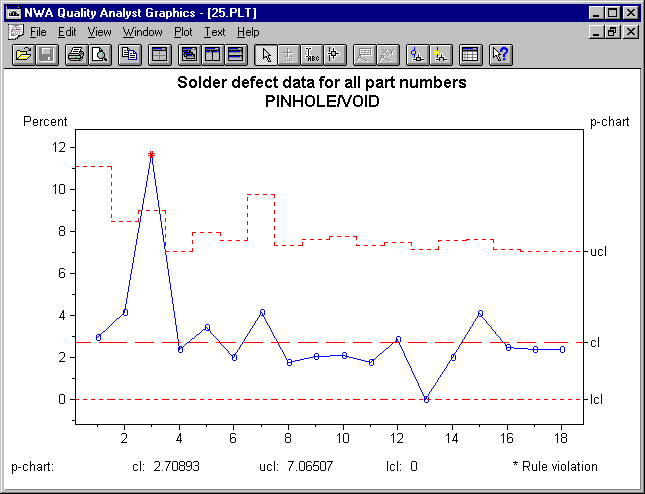 The same data used to generate Pareto diagrams can also be plotted as percent defective control charts. (See Figure 5.) The user can group several attributes—the top four defect categories, for example—in one display. (See Figure 6.) In this case all four categories exhibit statistical control at this time, although both cold solder and insufficient solder possess one out-of-control point each. The cold solder chart suggests the beginning of a process shift and should be monitored.
Application to Electronics Component Manufacturing
Although our example has highlighted PCB manufacturing, NWA Quality Analyst is used in a wide variety of electronics manufacturing. Since the electronics industry is highly competitive, engineers must continually change and improve their processes to reduce variability that could lead to waste and rework. NWA Quality Analyst is a very easy-to-use tool that allows them to identify where improvements could reduce costs.
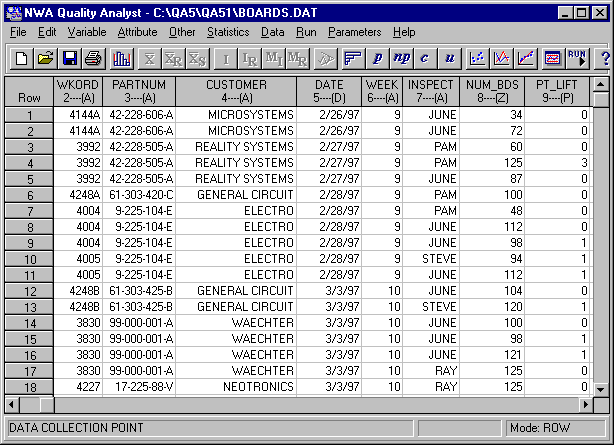 NWA Quality Analyst is a tool for variable and attribute analysis. The critical measures vary from manufacturer to manufacturer, but setting up the files within NWA Quality Analyst is easy because the software is configurable and has a spreadsheet-like look (see Figure 7).
Integration with Manufacturing Information Systems
Many electronics operations maintain production records in some type of manufacturing information system (for example, ERP, MRPII, MES, and so on). NWA Quality Analyst works well with these and has been integrated successfully with many database systems.
This success results from three NWA Quality Analyst capabilities:
- Straightforward data transfer
- Automated charting functions
- Parameterized charting and reporting properties
NWA Quality Analyst can readily accept data from external databases, spreadsheets, and manufacturing information systems. Data can be read in as delimited ASCII data files or as an ODBC (Microsoft's Open Database Connectivity standard) source. Once the ODBC source has been defined for a data set, its use is transparent to NWA Quality Analyst operation. The connection is automatic, and the user is always working with the most current data.
In addition to ready data transfer by data file or ODBC, NWA Quality Analyst has an internal scripting system that allows the user to define standard sets of charting and reporting operations, then initiate a defined operation with a single mouse click. The package and these scripts can also be called by other software such as MES.
Quality Analyst charts and reports can be easily configured to conform to virtually any analytical or reporting standards set by customers, regulatory agencies, or in-house quality-management staff. These parameters can be set using dialog boxes in NWA Quality Analyst or transferred from the manufacturing information system.
Plant-Floor Data Collection
Plant-floor data collection and SPC charting at the production line can help manufacturers meet in-house standards and satisfy vendor-certification requirements. A companion to NWA Quality Analyst-NWA Quality Monitor-helps electronics companies address such concerns. NWA Quality Monitor serves three basic functions:
- Operator Interface
- Direct SPC operation reduces error rates, provides access to SOPs and production information.
- Data Collection
- In addition to manual key entry, NWA Quality Monitor can be set up for direct data collection from RS-232 serial devices and bar code systems.
- Real-time Charting
- Provides the operator with immediate feedback at the inspection station.
NWA Quality Monitor uses the same file and chart formats as NWA Quality Analyst. Quality engineers can perform rigorous analysis of the data collected on the production line without having to rekey the data. Figure 8 shows that the data used to plot the previous charts was collected by the operator.
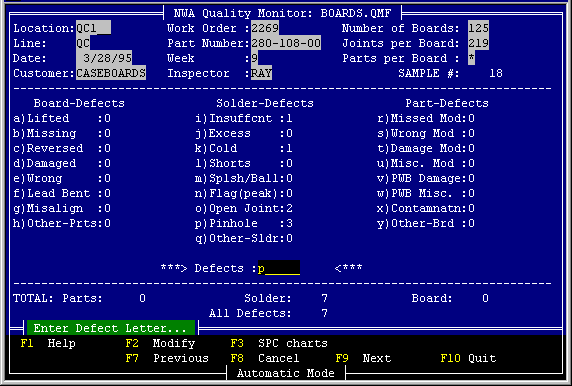 Such plant floor workstations improve SPC data collection while reducing disruption to production. Indeed, when properly configured for the assembly operation, the plant can use NWA Quality Monitor to help direct production and provide on line SOPs for the assembly staff. The versatility of the system expands the options available to the production management.
