SPC charts that show limited descriptions on the X-axis (some SPC packages only show the data row) are missing key information that is needed to clearly identify potential sources of excessive variation and reveal relationships. Including as much descriptive information as possible makes chart interpretation easier and more accurate. Something as simple as adding axis labels can transform your SPC charts into effective tools for solving problems and improving processes.
Quality Analyst allows users to select up to 24 description variables to appear on SPC charts, and provides a combination of axis labels and drill-down methods to use that information effectively.
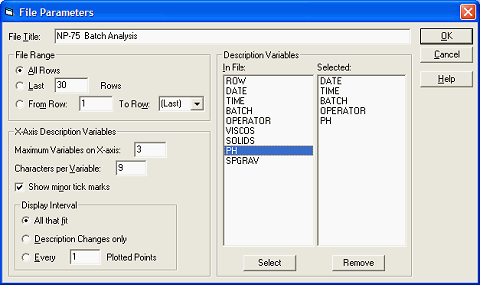
In Quality Analyst, descriptive information is added for each Data Set by assigning the desired variables to the “Description Variables” list by opening the Parameters menu and selecting File. You can select up to 24 Description Variables, and they apply to all SPC charts created from that Data Set. In this example, the user has decided to include Date, Time, Batch ID, equipment Operator, and the batch pH as descriptions (measurement values and defect counts can be included).

Figure 1
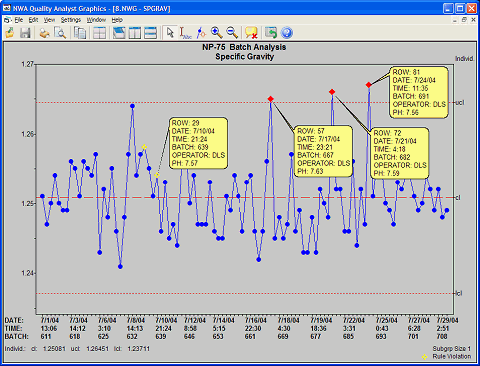
Description Variables in Quality Analyst show up on the X-axis of all SPC charts, and are also displayed in the Graphics Viewer’s “drill-down” tools: the Detail Window and call-outs displayed by double-clicking a point on the chart. By default, only the first three Description Variables selected will label the X-axis, with the remainder available for the “drill-down” displays (the more X-axis labels, the less room for the chart). This allows users to designate a limited number of descriptions for the X-axis – typically to establish the timeline – maximizing the amount of space allocated to the chart itself. The remainder of the descriptions can be viewed for each point by using the drill-down tools (Callouts and the “Detail Window”).
Creating an Individuals SPC chart of Specific Gravity for the Data Set used in this example shows the information content available by using Description Variables and the drill-down tools (Callouts, in this example).

Figure 2
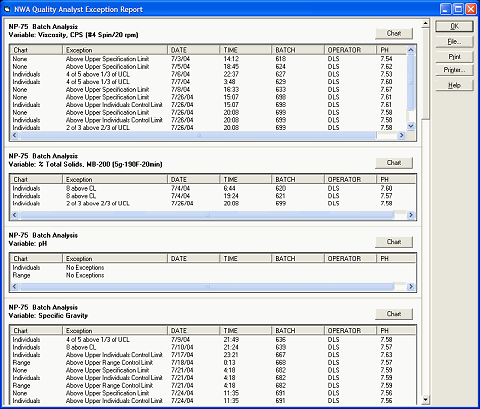
Description Variables are also automatically included in Exception Reports to help establish context for each exception.

Figure 3
