The goal of process management is to optimize production and manage it as effectively as possible. Hitting the mark requires dependable performance measures that everyone involved can use to make good decisions.
As the old adage goes, you can’t manage what you can’t measure. The question is how to identify the critical metrics, collect the right data and produce meaningful information. What is required to sort through all metrics to decide which should become Key Performance Indicators (KPI)? Given the goal of delivering appropriate role-specific actionable intelligence to each person, how do we apply the process analysis?
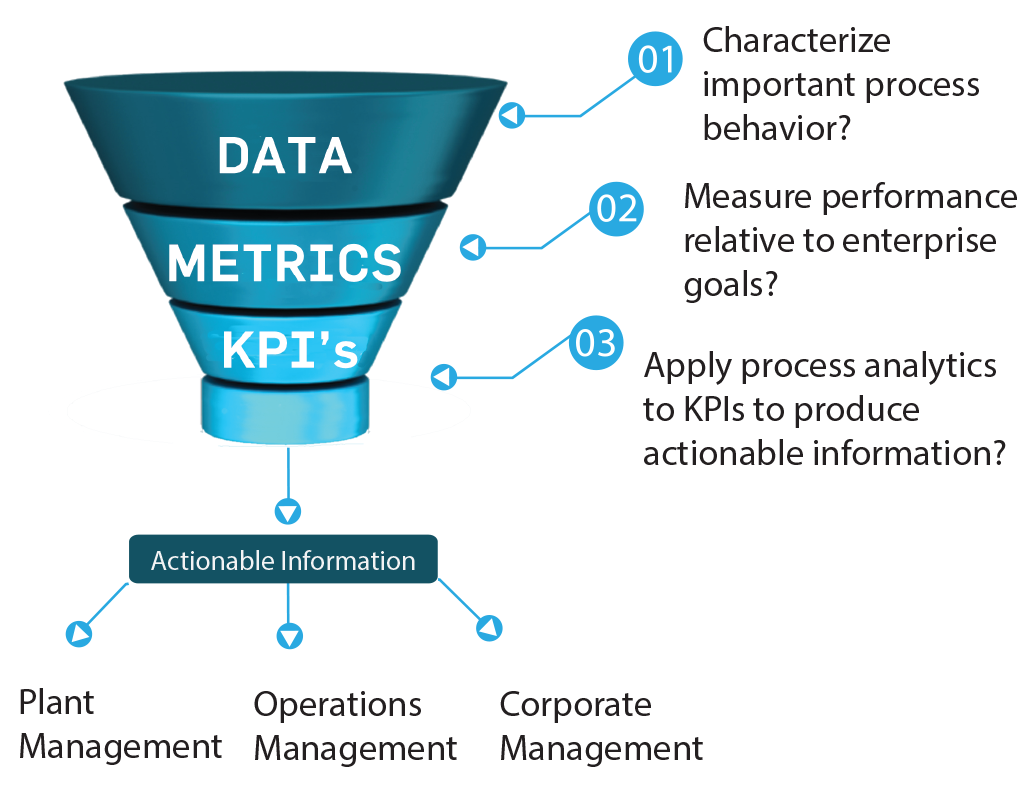 Fig.1 - Moving from Raw Data to Actionable Intelligence.
The story is always process and industry specific, but the process of winnowing metrics and combining them into KPIs is universal. The specific metrics related to a refinery cracking tower, a chemical plant reactor or a food processing retort will vary, but the KPIs used to evaluate the process typically provide some measure of throughput and yield.
The journey begins with the huge pool of process parameters such as the pressure measurement used in a control loop. However, as one proceeds through the process value chain, that particular pressure measurement is too granular and therefore must be aggregated into more appropriate metrics for different decision levels.
Choosing metrics is a defining moment since it establishes process boundaries. Selecting KPIs is even more rigorous since they are the significant few which guide operations management.
Determining the Right Metrics
Enterprise Manufacturing Intelligence (EMI) enables operations and management to take the correct actions based on real-time process information. The first step toward a working EMI system is to identify and collect the right process measurements, which requires applying a thorough understanding of each manufacturing process.
Just because a measurement can be made doesn’t make it useful. The task is to sort through the huge stockpile of possible manufacturing measurements and narrow the list to the significant few.
The transition from raw data to operational metric requires the process parameter provide critical insight into process performance and provide the basis for process control and improvement. Process management requires defining appropriate metrics supporting every level in the enterprise.
In an article from the NIST Manufacturing Engineering Laboratory, Development Overview of Sustainable Manufacturing Metrics , authors Feng and Joung identify seven characteristics common to well-defined manufacturing performance metrics:
1. Measurable – The metric must be quantitatively measureable.
2. Relevant and Comprehensive – The metric must provide useful information on the manufacturing process. It must fit the purpose of measuring performance and addressing all of the organization’s major aspects and objectives.
3. Understandable and Meaningful – The metric should be easily understood by everyone, especially those who are not experts.
4. Manageable – Metrics should be limited to the minimum number required for process management. All stakeholders should be involved in deciding the number and type of indicators.
5. Reliable – Information derived from the metric should be trustworthy and repeatable.
6. Cost-Effective Data Access – The metric has to be based on accessible data. The information needs to be currently available or be collected from either existing sources or those that can be feasibly developed.
7. Timely manner – Measurement is frequent enough to enable timely, informed decision making.
Elevating Metrics to KPIs
Management needs to identify and assemble operational data and the causal relationships that link operational metrics to business goals. KPIs are metrics but not all metrics are KPIs. Typically, a KPI is a metric that can be used to gage manufacturing business performance and judge success or failure.
The goal is to enable better understanding of manufacturing business performance.
In their article, “Harnessing Untapped Information for Enterprise Manufacturing Intelligence”, John Jackiw and Gilad Langer present an example from drug tablet production. An easily collected metric for tablet line production is the number of tablets pressed per minute. However, that does not provide the most useful process management information – yield of tablets that meet specifications.
The true KPI is the throughput of acceptable tablets. The value can be derived from two independent metrics – tablet press speed and percentage yield of acceptable tablets. When combined they give the critical information, the rate of producing merchantable tablets, which drives greater value through the system than the two original metrics individually.
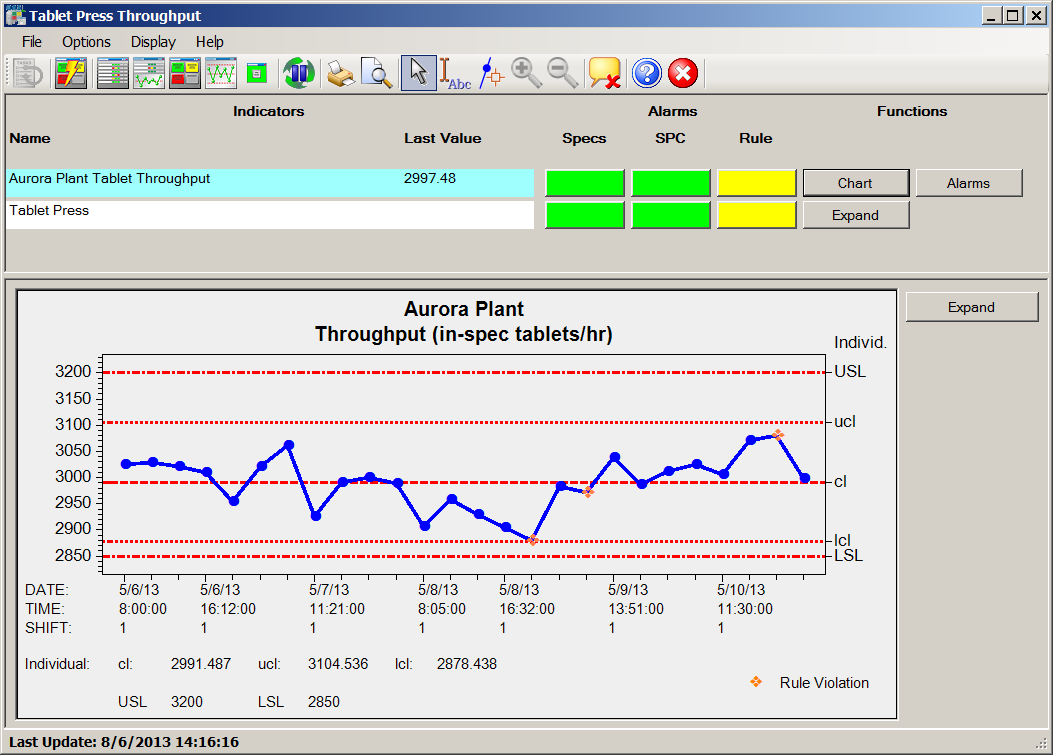
Fig. 2- Pill Press Throughput Chart
The EMI dashboard alarm shows SPC rule violations for the Throughput KPI. The control chart shows that while Throughput values are still within specifications and in statistical control, three points exhibit unusual behavior that could indicate process destabilization. This system has worked flawlessly, with absolutely no downtime in many years. Even low levels of impurities can be a big problem in the electronics industry and it is paramount that Praxair's process gas quality meets the industry's roadmap as chips get smaller and specifications tighter.
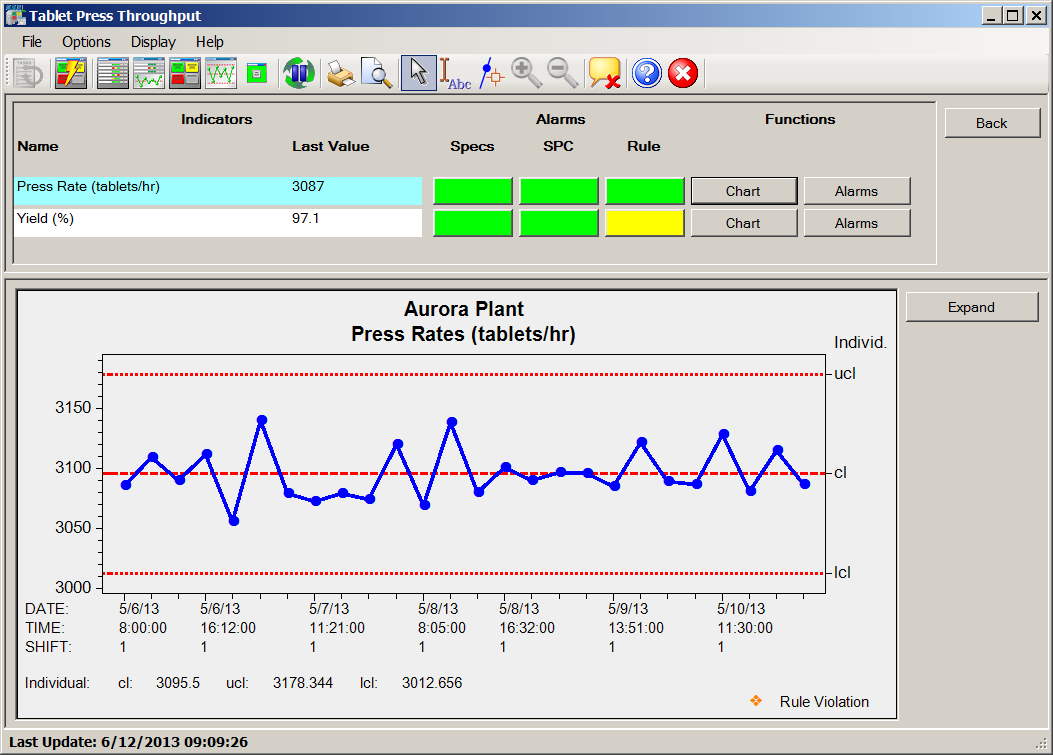
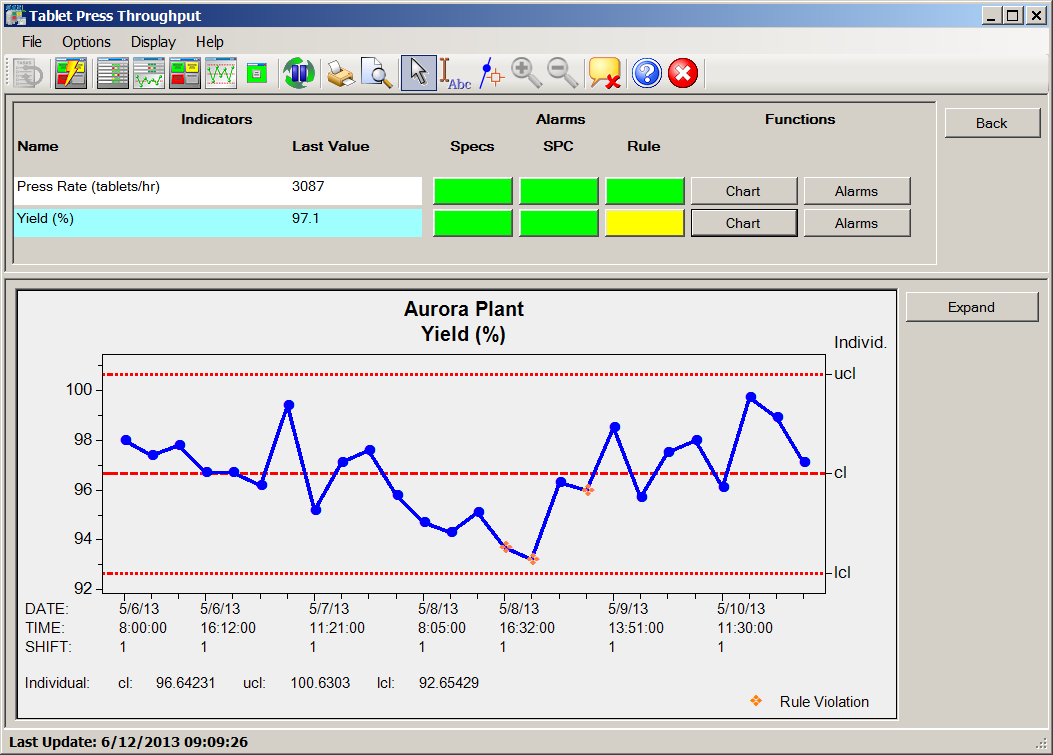
Drilling down to the Tablet Press displays the status of the metrics Press Rate and Yield which make up the Throughput KPI.
The metric Press Rate is in statistical control (no unusual patterns or high/low points) during the week of May 6 through May 10. The problem must be with the other component of the Throughput KPI.
The dashboard alarms and analytics show that Yield had rule violations and unusually low values on 5/8. This triggered engineering analysis and adjustments that corrected the problem before the process went out of specification and statistical control.
The KPI Throughput derives from the Press Rate and Yield metrics. It not only provides immediate operational decision support, but also provides a view of production capability useful for managerial decision making.
As the NIST study says, a metric must be a quantitatively measurable parameter. Therefore, analytics such as SPC can be applied and the statistical characteristics known and understood.
The same method works across all industries whether it is tracking tons of product produced per unit of feedstock, amount of a distillate produced from a barrel of crude or number of beverage containers produced per batch. In each case the yield constitutes a critical parameter bearing on business performance expectations that provide crucial decision support to management.
Manufacturing Analytics
As shown in Figure 1, the application of process analytics is the critical step that converts KPIs into actionable information for process management decision making. The tablet press case study illustrates how real-time SPC charts provide far more usable information than simple dashboard alarms. With the SPC warning signals alerting engineering and EMI directing problem solving, process management moves from reactive to proactive.
SPC analytics can use methods such as rule violations to call attention to process instability before it goes out of control and causes significant problems and costs. With drill-down capabilities, EMI dashboards can also track the stability of each metric and alert to process exceptions in real time even before the KPI charts show signals. This is the genius of EMI – running the operation with complete information and understanding as opposed to the limited perspective provided by go/no-go alarming.
Process analytics also characterize the behavior of the metrics used to form KPIs. The goal is to track parameters that are stable during normal operation and respond to process deviation. The behavior should be predictable except when there is a problem. If a KPI is designed to reflect key process elements and warn about specific behavior, it can’t be influenced by an unstable component.
Actionable Intelligence
The end goal of identifying a set of metrics, collecting data and applying process analytics is to provide actionable intelligence that supports effective decision making. Jackiw and Langer summarize the path to actionable intelligence:
- Performance management should focus on the business processes and not a specific technique.
- Actionable intelligence is the ultimate goal of information. It should direct the user to a clearly evident action.
- Defining the right metrics is the most critical action closely followed by identifying the data requirements.
- Trends matter more than actual values and help elevate the information to actionable intelligence. Applying real-time analytics detects the significant trends and shifts that inform the actionable intelligence used to prevent problems before they cause process upsets or increased costs.
- Context is vital to analysis and enhances users’ ability to interpret patterns and make decisions. With context users can more quickly evaluate the situation without time-consuming searches through process records.
- Collection and analysis of metrics information should be automated to reduce the impact of ‘personal interpretations’.
- The information from manufacturing operations should be as close to real-time as possible.
This list echoes the one from the NIST Manufacturing Engineering Laboratory and establishes a solid foundation for populating EMI decision support dashboards. Routine evaluation of the KPIs ensures that the underlying data is stable enough to ensure they are effective and that the KPIs deliver the desired actionable information.
In John Jackiw’s webinar, “Metrics, KPIs, and Process Insights – Implementing High Performance Manufacturing Intelligence”, he proposed a structured approach to deciding the relative value of individual metrics, when to promote metrics to KPIs and how to dependably produce actionable intelligence using process analytics. This approach delivers on the promise of EMI – producing the best actionable information to eliminate guesswork in corporate decision making. Click to watch the webinar in its entirety.
