Manufacturers are always trying to increase throughput while maintaining process stability and product quality. One common solution is to deploy equipment which simultaneously produces multiple units with each cycle. This type of equipment includes multi-head fillers, multi-cavity molding and multi-spindle machining centers. These manufacturing applications are often referred to as “family processes”.
Production which frequently uses family process methods includes metal, glass or plastic package manufacture and filling; cast or molded metal and plastic product manufacture; and machining with multiple grinders or spindles among others.
Family processes share many or all the following characteristics:
|
Characteristic |
Example |
|
The “family” consists of multiple similar or identical member processes originating from a common source or manufacturing stream. |
A bottling line may have 24 fill heads. |
|
The member processes are completed more or less simultaneously. |
All bottles are filled in a single step.
|
|
Each member process may have its own mechanical component(s) or subsystem. |
Each bottle filler head has its own supply tube and fill head. |
|
Each member process has its own sources of variation. |
Bottle filler head performance can vary independently. |
|
The family process as a whole is subject to its own global causes of variation. |
Bottle fill line pressure may fluctuate. |
Measuring Performance of Family Processes
Family processes are widely used because they substantially increase the throughput and operational convenience of a manufacturing line. However, there are real problems monitoring and controlling family processes with conventional charting methods.
Family processes are affected by two types of factors: those that influence all family members and those that influence only the individual member. Since control charts such as X-Bar show only global sources of variation, they cannot pinpoint local assignable causes for individual family members.
For example, consider the results when a single-fill channel is blocked in a 12-cavity mold. An X-Bar control chart uses a random sampling from all cavities and therefore cannot identify the specific cavity with the obstructed channel. The channel may remain blocked, yet the chart will show the overall process to be in statistical control. Conversely, charting each cavity—each family member—would be impractical and time-consuming.
When they confronted the process monitoring problems presented by family processes, two quality consultants, Perry Holst and John van der Veen, turned to a valuable but underutilized analytical technique, Median/Individual measurements (M/I) control charting. “The power of the M/I chart,” says van der Veen, “is in its ability to display sources of variation separately. This allows you to identify the source of any problem and take appropriate action.” By using M/I charting, manufacturers can avoid improper interpretation of data and the subsequent problems of over-adjustment and unnecessary batch replacement of tools, machine parts or equipment.
As the name implies, Median/Individual charting examines data from both perspectives. The median is the midpoint of a sample’s measurements and therefore tracks the global process. The Individuals chart shows the behavior of single members in the measured family.
When the median is in control, it typically indicates that the overall process is in control. If the median trends out of control, the global process is likely also out of control. If all family members are in control, no individual stands out. If an individual member charts out of control, the operator should look for a local assignable cause.
In a trial application using M/I charting, a major motor oil producer analyzed data from a 36-head bottle filling line. To determine fill, weights were recorded from the filled bottle conveyor. Subsequent process changes included adjusting a chronically malfunctioning fill head identified through M/I charting. Soon fill variation was reduced below bottle tare variation. This prompted the producer to recommend M/I charting to its bottle manufacturer, a multiple cavity mold user.
After this trial, the lubricant producer applied M/I charting to all of its lines. They realized a savings of some 600,000 gallons of motor oil annually from improvements in fill operations alone.
Median/Individual Measurements Control Charts For Family Processes
A family process consists of a number of statistically independent processes that are affected by common factors. Often, there are too many independent processes (family members) to chart each one separately. This causes manufacturers to examine the entire family process by combining the independent processes in a single X-bar control chart using small random samples (n=5, for example).
These efforts are futile, because such charts are insensitive to the independent processes. In contrast, M/I charts show both the behavior of the entire family process and the independent processes. As a result, M/I charts foster process improvement by focusing attention on the outlying independent processes.
Insensitivity
In single output processes, all process factors are global—the product is acted upon by every factor in the process. A change in any global factor will result in a corresponding change in the final product. Therefore, when plotted on an X-bar chart, a small sample of contiguous output will inarguably show product variation caused by global factors.
However, the output of family processes is also subject to statistically independent individual factors. That is, each member of the family has its own set of localized variations. These local variations affect an X-bar chart only when they are by chance included as part of the sample.
For example, if an operator samples five units from a 32-cavity mold, the probability of a particular cavity not being included in the sample is 83.3%. With hourly sampling, production may go for a full shift or even a full day without sampling one of the cavities. (Table 1) This insensitivity defeats one of the primary reasons for using control charts: early detection of process changes leading to nonconforming production.
Table 1
|
Table 1 |
|||
|
No. of Cavities |
1 Sampling |
8 Hours |
24 Hours |
|
8 |
11.6% |
0.0% |
0.0% |
|
16 |
63.9% |
2.8% |
0.0% |
|
24 |
77.2% |
12.6% |
0.2% |
|
32 |
83.3% |
23.2% |
1.2% |
|
48 |
89.1% |
39.8% |
6.3% |
|
64 |
91.9% |
51.0% |
13.3% |
When a faulty cavity is part of a sample that leads to an out of control point, the usual response is to adjust global process factors. If the offending family member is not included in the next sample, the process will then appear to have been properly adjusted. In fact, the operator will have erroneously changed a process that was actually in statistical control, causing the process to now trend out of control.
In a multiple head filling line, the global process may chart as centered within the control limits, yet individual heads may simultaneously short fill and overfill. If global factors trend up from center, more samples start to show some overfill. Using this information the operator would then adjust the process downward. Soon the samples start showing short fills and the operator adjusts the process upwards. This never-ending cycle of adjustment produces nonconforming products most of the time. The actual solutions would be either to adjust the extreme heads towards center to accommodate global variation or to reduce the amount of variation in the offending individual family members.
If control limits are calculated from enough historical data to include all the effects of locally induced variation, the control limits will then be artificially inflated. This compounds the problems of small sample X-bar charts. The result will be that the global factors will be poorly and inadequately controlled.
One obvious alternative is to use a sample consisting of one unit from each individual of the family. Significant individual variations will show as out of control on the range chart. This approach primarily conveys information from the global effects; we still lack sufficient information to easily identify offending individuals. Moreover, an individual can exceed its expected variation and still not show up as an out of control point on the full sample X-bar chart.
Inefficiency
Another alternative is to keep separate small sample X-bar charts for each individual family member. However, the logistics of collecting even as few as five samples from each member is both impractical and inefficient; for a 16-cavity mold, sample collection would involve sorting by cavity, measuring, and plotting 80 units for each sample period. Larger family processes often may have as many as 64 or more members. Data gathering and analysis for hourly samples would be a full-time job and still produce delayed results. Additionally, charting each family member does not readily convey information about global factors affecting the process.
Finding a solution
The dilemma posed by family processes required an innovative solution. In the book Statistical Quality Control, Grant and Leavenworth proposed manually combining the results of median charts with individual measurements charts. Individual measurements track local variations, while median charts monitor global variation. Median charts require no calculations by the operator, eliminating still another potential source for errors. Range variations are inherently visible in the plot of each sample.
In a median chart, each sample or observation consists of a unit from each member of the family. Sampling frequency is process-dependent; initially, sampling should be frequent enough to profile the process. Ongoing sampling frequency depends on the rate of variation. Stable processes need to be sampled less frequently.
A median ( ) is a measurement of central tendency similar to mean (
 ). The median of a sample is that point which divides the values of the individual (
 ) measurements in half. 50% of the values are greater than the median and 50% are less than the median. If the sample size (n) is an odd number, the median is the value of the middle individual measurement in the sample. If n is an even number, is the average of the two middle values.
Calculating the average median ( ) is similar to calculating a control chart’s grand average.
For 15 subgroups, the formula for the average median is:

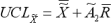
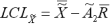
The method for calculating median control limits is similar to X-bar control limits except the  factor is used instead of the
  factor. (See Table 2.)
NWA Quality Analyst automatically calculates these factors for the user.
While an individual measurement control chart is less sensitive to changes in the process average than the median control chart, each of the individual measurements is actually plotted. For a family process this means that each of the family members is charted and controlled.
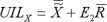
Individual measurement () control limits are calculated much the same as median control limits, except that  from the control chart factors table (Table 2) is used.
(NB: The formulae for median and individual control limits are provided for reference only. NWA Quality Analyst automatically calculates all control limits.)
|
Table 2 |
|||
|
|
|
|
|
|
3 |
1.023 |
1.187 |
1.772 |
|
4 |
0.729 |
0.796 |
1.457 |
|
5 |
0.577 |
0.691 |
1.290 |
|
6 |
0.483 |
0.548 |
1.184 |
|
7 |
0.419 |
0.508 |
1.109 |
|
8 |
0.373 |
0.433 |
1.054 |
|
9 |
0.337 |
0.412 |
1.010 |
|
10 |
0.308 |
0.362 |
0.975 |
|
Most control chart constants tables dealing with medians do not show sample sizes greater than 10. NWA Quality Analyst calculates control limits correctly for any sample size. In the table above, |
|||

The combined M/I chart produces upper and lower individual control limits in addition to median control limits. The median shows any overall process changes; individual limits alert the operator to any individual member’s variation sufficient to exceed normal distribution.
Benefits
M/I Charts for family processes are exceptionally easy to use and interpret. Analysis is made much more efficient by differentiation between and identification of global and local causes of variation; nonconforming product is detected much faster and more reliably. Overall process variation can be reduced by centering the individuals. Operator errors which result from either measurement or calculation are minimized or eliminated.
Interpreting Median/Individual Measurements Control Charts
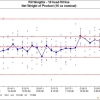
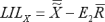
 Interpreting an M/I chart is relatively simple. The median is represented by a moving line, generally around the chart center line (CL) (See Figure 1). Individuals are represented by points vertically aligned according to sample. In NWA Quality Analyst, points outside the individual measurement control limits are automatically identified by part number.
This chart of a filling operation illustrates the strengths inherent in M/I charting and analysis. The median, represented by the moving line, tracks the global process. Median control limits are marked “ucl” and “lcl” for upper and lower limits, respectively. If the median trends out of control, the causes are likely global.
Individuals are shown as plus marks (+) in columns that represent an entire sample subgroup. Upper and lower individual limits are shown as “uil” and “lil”. Individuals that fall outside these limits (outliers) may indicate the presence of local causes of variation. Outliers are identified by their fill head number. In this example, fill head 5 has twice exceeded the upper control limit and fill head 7 has dropped below the lower control limit once. With NWA Quality Analyst, the user may select charting characters, including identification of all family members by number.
If the median is within its limits and one or more individuals exceed their limits, the problem lies with the offending individuals. If the median exceeds its limits, global process change is indicated. Individuals should be ignored, even though they may also exceed their limits. Correction of the global assignable cause will bring the median back within control limits.
Individual family member performance is controlled by identifying those that consistently approach 2.5 σ of the population distribution. These outliers are apparent at a glance and may be producing nonconforming product. Because they are easily identified on the M/I chart, outliers can be adjusted or altered to reduce process variation, thus improving overall capability. Additionally, their identification makes possible further process improvement using other, off-line statistical techniques.
Individual members usually show stratification in M/I charts. That is, an individual will maintain its relative position on the chart within its variation. If individuals move excessively (i.e., from either extreme toward the median), individual process variations are excessive and require investigation.
There is one exception to the observation of individuals. A chart that shows individuals simultaneously exceeding both upper and lower control limits may indicate that overall process variation has changed. This is the equivalent of an out of control Range chart. In fact, in this situation, the recommended first step in analysis is to make a Range or standard deviation chart from the previous stable observations to determine if the overall variation has gone astray. However, if these individuals have been hovering at their limits, it may be that the offending individuals have, in fact, simultaneously responded to local causes.