
NWA Quality Analyst 6.3® incorporates twelve enhancements to the analytics and reporting capabilities. These result from the development of NWA Focus EMI® and enable Quality Analyst to deliver a richer Enterprise Manufacturing Intelligence (EMI) analytics and reporting feature set.
New Features
- SPC Pattern Rules Selectable by Variable
- Additional Sets of Specifications
- Added Actions for Warning and Inner Limits
- Out-of-Spec Plotting Characters for SPC Charts
- Showing Tagged Data on SPC Charts
- "Data Brushing" on SPC Charts and Other Graphics
- Graphics X and Y “Zoom”
- Bivariate Scatter Plots for Multivariate SPC Charts
- “First N Rows” Range for File, Display, and Recalculation
- Improved Control Chart Parameters dialog
- New Histogram, Capability Report, and Boxplot Statistics
- New Exception Report Statistics
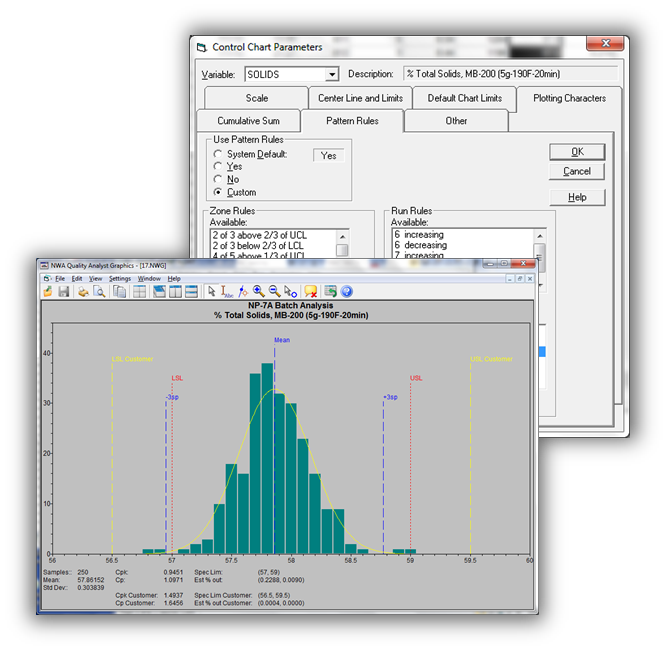 1. SPC Pattern Rules Selectable by Variable
The pattern rules that are applied to control charts can now be selected for each variable. Previously they were selected globally and could only be set to on or off by each variable. The rules must already be defined in Quality Analyst “Settings”. This allows analytics to be tailored to individual process variables for real-time and EMI applications.
2. Additional Sets of Specifications
In addition to defining Upper (USL) and Lower (LSL) Specification and Target values for each variable, up to 10 additional sets of specifications may now be set for each variable. The specifications, specification violations, and capability indices are displayed on the histogram, capability report, and exception report. The specifications may be enabled or disabled as desired. The additional specifications can be useful when multiple specifications are used for different purposes, such as for different customers or different stages of manufacturing and packaging.
3. Added Actions for Warning and Inner Limits
Points that violate Warning and Inner limits can now be highlighted with unique plotting characters on SPC Charts, appear on Exception Reports and are now listed in the Graphics (NWG) files that can be used by other NWA software. This provides more flexible analytics for exception reports, real-time reporting and EMI applications.
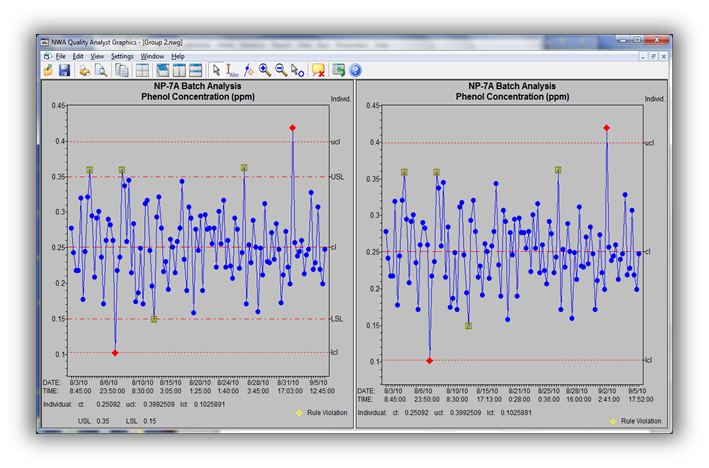 4. Out-of-Spec Plotting Characters for SPC Charts
Measurements that violate the upper or lower specification limits can now be identified on SPC Charts with an alternative plotting character and color. This feature is available only with the primary specification limits. This is designed to provide more flexible analytics and visualization for normal SPC reporting and real-time/EMI applications.
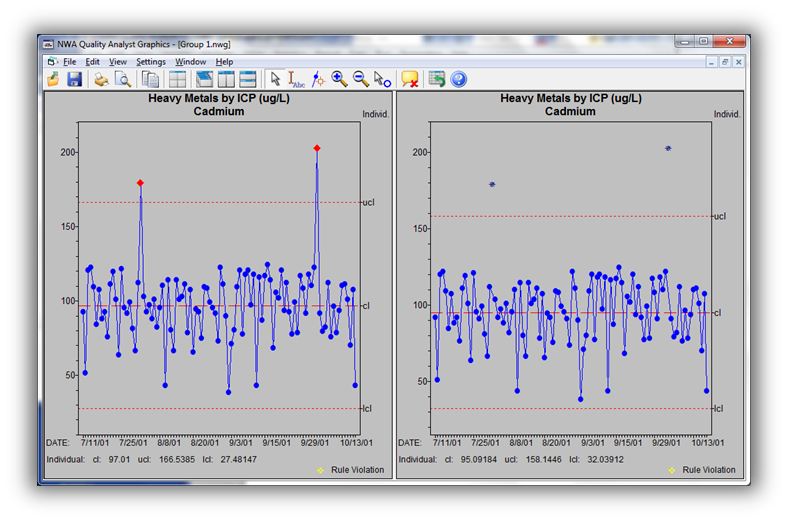 5. Showing Tagged Data on SPC Charts
Tagged data can now be shown on control charts while being excluded from control limit calculations and statistical analysis. The tagged points are plotted separately with a unique symbol and color, and are not connected with a line to the untagged data. These "ghost" points are not included in the SPC data (not connected by the data line) and are not used in calculations.
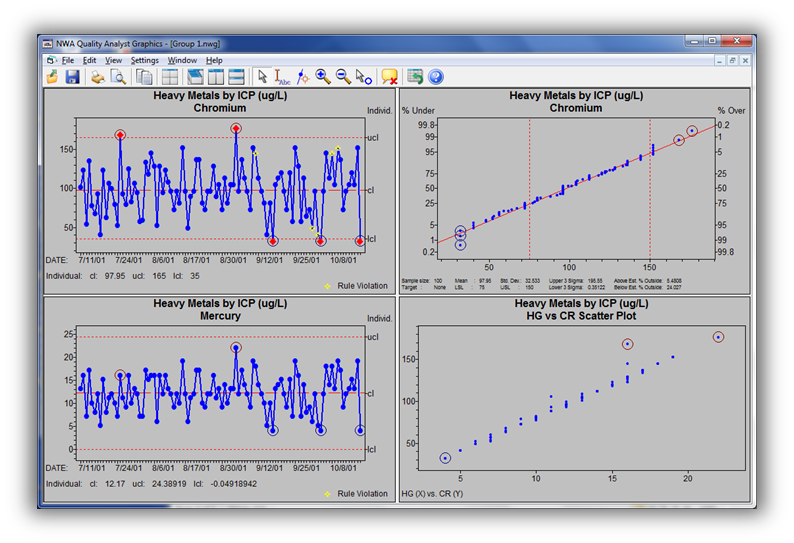 6. "Data Brushing" on SPC Charts and Other Graphics
Points common to the same Data Set record can now be highlighted on different charts with a technique known as "Data Brushing". When SPC Charts, Scatter Plots, Run Charts, or Normal Probability Plots are created using the same Data Set, points selected on one chart will be “brushed” on other charts to highlight points from the same Data Set row. "Brushed" points are circled, with two colors available.
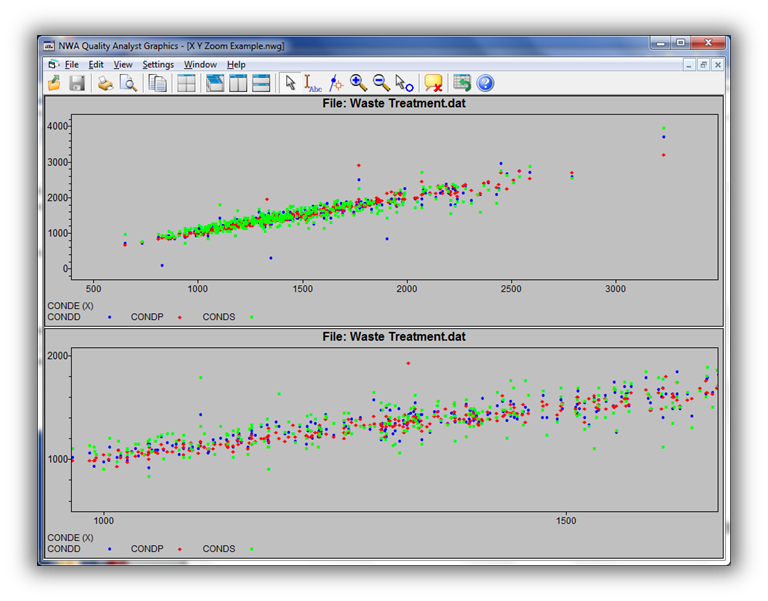 7. Graphics X and Y 'Zoom'
Selected graphics types can now be zoomed on both the X and Y axis direction. The enhanced zoom works with the Scatter Plot, Normal Probability Plot, and Run Charts. This was added as a general improvement for MvSPC and is available for other graphics.
8. Bivariate Scatter Plots for Multivariate SPC Charts
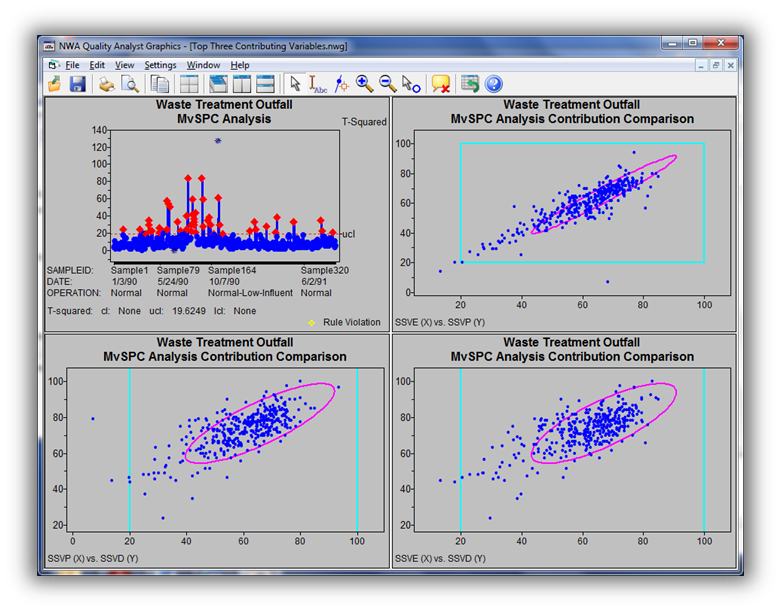
Bivariate scatter plots with a 95% confidence bound and specification limits can be generated when using multivariate models. The bivariate scatter plot can be created from the QA Data or in a RUN file with the BIVARIATE command.
If a Multivariate SPC chart (T-squared or SPE) is displayed, bivariate plots can also be generated directly from a variable contribution Pareto. Double clicking on a Multivariate Chart point displays the Contributions Pareto and right clicking on the Pareto selects and compares the top two or top three contributing variables. One or three bivariate scatter plots will be displayed depending on the selection.
9. “First N Rows” Range for File, Display, and Recalculation
A “First N Rows” data range is now available for File-wide and Variable ranges. Like the “Last N Rows” range, the new range is always based on the current Data Set rows.
10. Control Chart Parameters dialog improved
The Control Chart Parameters “Chart Type” now defaults to the "Individuals" chart for type “I” data (instead of "X-bar"). Also, changing the selected Variable no longer changes the selected Chart Type.
11. New Histogram, Capability Report, and Boxplot Statistics
New statistics are available for Histograms, Capability Reports, and Boxplots.
- Sum
- Count below LSL
- Count above USL
- Count outside specifications
- Estimated ppm (parts per million) below LSL
- Estimated ppm above USL
- Estimated ppm outside specifications
- Actual ppm below LSL
- Actual ppm above USL
- Actual ppm outside specifications
- Additional specification ID
12. New Exception Report Statistics
The exception report has a new 'count' and 'percent out-of-control' summary for each chart.