One of the seemingly deep mysteries of SPC (and often-asked questions for NWA Technical Support) concerns the relationship between Histogram 3 sigma limits and Control Chart 3 sigma limits. The limits are used for different purposes: Histogram limits evaluate process capability, Control Chart limits separate common variation from special variation. Still, two main factors produce confusion:
1) Both are "3 sigma" limits. The unasked question is "sigma of what?" The histogram limits use sigma of the individual measurements. The control chart limits use sigma of whatever is being charted, usually X, the mean. The relationship between sigma of the individual measurements and sigma of X is:
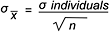
Where n is the subgroup size.
2) Different estimates of sigma are used for the histogram and the control chart. Histogram limits use the sample standard deviation in order to capture all of the variation. Control charts use average subgroup Range (or average subgroup standard deviation) to capture only the "within subgroup" variation. The histogram limits include the total of both "within subgroup" and "between subgroup" variation:

A control chart uses only "within subgroup" variation to set limits. Therefore when "between subgroup" variation occurs, it's signaled by out of control points. When a process is in control, there's no "between subgroup" variation and  is equal to
  . When the process is out of control, the two sigmas can differ dramatically. Even when the process is in control, the two estimates of sigma will differ slightly; they're only estimates.
A final factor can cause the limits to differ:
3) Histogram capability limits can be based on a non-normal distribution. With a normal distribution, 3 sigma limits enclose 99.73 percent of the distribution. With a non-normal distribution, limits are also set to enclose 99.73 percent of the distribution. Because the non-normal distribution has a different, non-normal shape, the limits end up either greater or less than 3 sigma limits.
Histogram and Control Chart: Same Data, Different Limits