

Cpk vs Ppk: What Each One Measures and When to Use Which
Cpk and Ppk use the same formula and differ in one input - the estimate of process standard deviation, or sigma. Cpk uses the variation within subgroups, so it describes what the process can do when only short-term noise is present. Ppk uses the variation across all the data, so it describes what the process actually delivered over the period you measured. When a process is stable, the two numbers land close together. When they do not, the gap is telling you something. On continuous and batch processes, it is often telling you that Cpk is too optimistic.
Cpk vs Ppk at a glance
| Cpk | Ppk | |
|---|---|---|
| Full name | Process capability index | Process performance index |
| Sigma used | Within-subgroup (short-term) | Overall, from all data (long-term) |
| Variation it counts | Noise inside subgroups only | Everything: shifts, drifts, batch-to-batch differences |
| Question it answers | What could this process do if nothing changed between subgroups? | What did this process actually deliver? |
| Requires a stable process | Yes. Without stability, Cpk has no meaning. | Can be calculated anyway, but then it only describes the past |
The formulas are identical apart from sigma:
Ppk = min [ (USL − x̄) / 3σoverall , (x̄ − LSL) / 3σoverall ]
USL and LSL are the upper and lower specification limits, set by the customer or by engineering, and x̄ is the process average. Specification limits are a different thing from control limits; see control limits vs specification limits. Cp and Pp make the same comparison without accounting for centering; see Cp, Cpk, Pp and Ppk explained for all four indices.
What does Cpk measure?
Cpk measures how many three-sigma widths fit between the process average and the nearest specification limit, using only the variation inside subgroups. A subgroup is a set of measurements taken close together under the same conditions, such as five samples drawn in the same hour. A Cpk of 1.33 means the nearest specification limit sits four sigma from the average.
Cpk ignores whatever changes between subgroups. That makes it a statement about potential. The authors of a 2023 Pharmaceutical Engineering article describe Cpk as the capability the process would have if its long-term shifts were removed. It does not describe what your customer received.
What does Ppk measure?
Ppk uses the same ratio, but sigma is the ordinary sample standard deviation of every data point in the period, so shifts, drifts and batch-to-batch differences all count against the process. ASTM notes that the Ppk calculation is meant to capture long-term shifts and drifts, such as tool wear or a change of operator. Ppk is therefore the better description of the product that was actually shipped.
The limit on Ppk is that it only describes the data you gave it. If the process was unstable during that period, Ppk is an accurate summary of an unstable past. It says nothing reliable about next month.
Why do Cpk and Ppk give different numbers?
Cpk and Ppk diverge only when something adds variation between subgroups that does not show up within them. Donald Wheeler’s argument, published by SPC for Excel, is that for a process in statistical control, Cpk and Ppk come out very close to equal. A large gap is therefore a finding in its own right. The usual causes are:
- The process shifted or drifted during the period: a new raw material lot, a production campaign, catalyst aging or a seasonal change.
- Batches differ from each other more than samples within a batch differ.
- Readings are autocorrelated, meaning each one resembles the last, so short-term variation is understated. The next two sections cover this case.
Ppk can occasionally come out higher than Cpk. The usual causes are sampling noise in a small data set, or a pattern that inflates the within-subgroup estimate. Examples are an operator adjusting after every reading, so consecutive values alternate, or subgroups that mix separate process streams. In every case, check the control chart before reporting either number.
“Within-subgroup sigma” is not one number
Most capability reports show a single Cpk. Behind it sits a choice among several estimates of within-subgroup sigma, and for the same data the choice changes the result. The same distinction explains why three-sigma limits on a histogram differ from three-sigma limits on a control chart.
| Method | Calculation | Typical use |
|---|---|---|
| Average range | R̄ / d2 | Small subgroups, usually fewer than 10 readings |
| Average standard deviation | s̄ / c4 | Subgroups of 10 or more |
| Pooled standard deviation | Square root of the average within-subgroup variance, weighted by degrees of freedom | Subgroups of equal or unequal size |
| Average moving range | MR̄ / 1.128 | Individual readings, one per time point |
On well-behaved data these estimates land close together. On real process data they can diverge, and the way subgroups were formed matters as much as the formula. In a continuous process, a subgroup of five consecutive readings taken a minute apart captures almost none of the variation the process really has. Any within-subgroup method will then return a small sigma and a large Cpk. A capability report that does not state its sigma method and its subgrouping is missing the two facts you need to interpret it.
Why Cpk overstates capability in continuous and batch processes
In continuous and batch processes, each reading tends to resemble the one before it. Statisticians call this autocorrelation. It breaks the independence assumption behind the moving-range estimate:
- Consecutive readings differ by very little.
- The average moving range comes out small.
- Within-subgroup sigma comes out too small.
- Cpk looks better than the process is.
A 2023 Pharmaceutical Engineering case study shows the effect in pharmaceutical data. With drift visible on the individuals chart, the authors note that the short-term estimate taken from the moving range and used for Cpk understated the overall variability, while the subpopulations in the data inflated the long-term standard deviation and pulled Ppk down. They place the true capability between the two numbers.
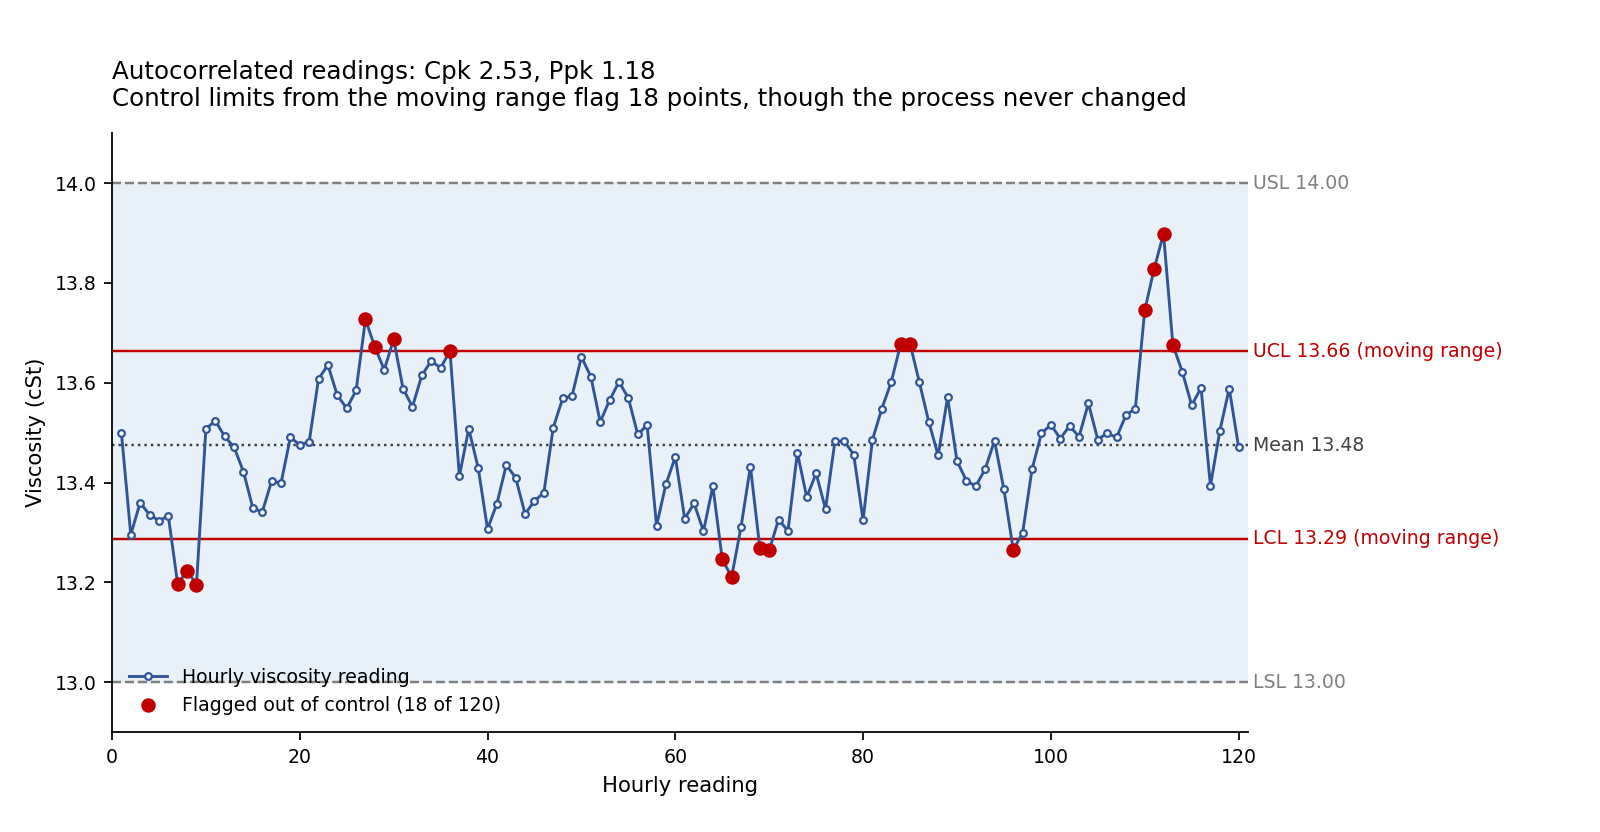
A worked example (hypothetical, simulated data). Take 120 hourly viscosity readings from a continuous blending unit over five days, with a specification of 13.0 to 14.0 cSt. The simulated data carry strong hour-to-hour carryover, with a lag-one autocorrelation of 0.77. That is the kind of behavior a large, well-mixed vessel produces.
| Statistic | Value |
|---|---|
| Average | 13.48 cSt |
| Average moving range | 0.071 cSt |
| Within sigma (MR̄ / 1.128) | 0.063 cSt |
| Overall sigma | 0.134 cSt |
| Cpk | 2.53 |
| Ppk | 1.18 |
The same data produce a Cpk that looks excellent and a Ppk below the common 1.33 threshold. No reading fell outside specification, and nothing changed in the process. It wandered slowly, which is how this process normally behaves. Here the overall sigma is the honest one, because that slow wander is what the customer receives.
A control chart built from the same moving range shows a second cost. Its limits of 13.29 to 13.66 cSt flag 18 of the 120 readings as out of control, although nothing happened. This is how autocorrelated data produces an alarm flood, and why operators stop trusting alarms.
For contrast, run the same calculation on 120 independent readings with a similar overall spread. The two indices agree: Cpk 1.23, Ppk 1.26. The gap in the first case comes from autocorrelation alone.
Batch processes have a related problem. If subgroups are formed within a batch, Cpk measures within-batch consistency and ignores batch-to-batch differences, which are often the larger source of variation.
When autocorrelation or distinct clusters are present, neither index is automatically right. The ISPE authors concluded that in their autocorrelated case the true capability sat somewhere between Ppk and Cpk. In a separate case with campaign-to-campaign clusters, they found that capability calculated within each subpopulation described the real risk better than a single Ppk. Understand the structure of the data before choosing the number.
When to use Cpk and when to use Ppk
Check stability on a control chart first, because capability is defined for a stable process. ASTM E2281 defines process capability as the natural or inherent behavior of a stable process in a state of statistical control. Then match the index to the situation:
- Stable process, independent data: report both. They should agree closely. If they do not, find out why before sending either.
- Unstable process: do not report Cpk. Ppk summarizes what happened and nothing more. Fix the process, then repeat the study.
- New process or short run: use Ppk as a preliminary estimate and label it as tentative. The ISPE authors note that Ppk can be unstable until 60 to 90 results are included. The NIST/SEMATECH e-Handbook states that about 50 independent data values is generally treated as a large enough sample for capability estimates.
- Continuous or batch process with autocorrelation: treat moving-range Cpk as optimistic. Rely on Ppk, or calculate capability per campaign or per batch when the data show distinct clusters.
- A customer asks for “Cpk of 1.33 or better”: ask which sigma method and data period they mean. Then send both numbers with the method stated.
What is a good Cpk or Ppk value?
A value of 1.33 is the most widely used minimum for both indices. For normal, independent data, the ISPE authors’ table shows that a Ppk of 1.33 corresponds to about 0.003% of results beyond the nearest specification limit, against about 0.135% at 1.0. Their proposed risk scheme treats a Ppk of 1.33 or higher as low risk and anything below 1.0 as high risk.
Two caveats apply. Those translations hold only when the data are normal and independent and identically distributed. And a value reported without its sigma method, data period and stability check cannot be compared with any other value.
The same logic rules out averaging capability across processes. A plant-level Cpk built from many processes lets the capable ones hide the one that is failing. Report capability per process, where the number means something.
Three questions to ask your SPC software
Before you report a capability index, you should be able to answer three questions:
- Which sigma method produced this Cpk, and how were the subgroups formed?
- Were the data checked for stability and autocorrelation before the index was calculated?
- Has the calculation itself been validated against reference data?
The third question is harder than it looks. No external conformance standard exists for SPC software, so the only evidence that a tool calculates correctly is the vendor’s own validation work. Ask to see it.
NWA Quality Analyst calculates control limits and capability directly from live production data in historians, LIMS and databases. NWA maintains an internal validation program for its statistical engine, which includes:
- reference datasets checked against published ASTM reference data
- numbered test plans with signed execution records
- full revalidation whenever computational code changes
See how NWA Quality Analyst calculates capability on your own process data. Schedule a demo.
The number to watch
Report both indices, state the sigma method, and treat the gap between Cpk and Ppk as the most useful line on the report. For definitions of all four indices, including Cp and Pp, see Cp, Cpk, Pp and Ppk explained.