

Cp vs Cpk: Why the Two Numbers Disagree and What the Gap Tells You to Fix
Cp and Cpk use the same process standard deviation and the same specification limits, so they can disagree for only one reason: the process average is not at the midpoint of the specification. Cp is the average of the capability on each side of the process, and Cpk is the worse of the two sides. The gap between them is capability lost to centering, and it tells you whether your next step is a setpoint adjustment or an improvement project to reduce variation.
This guide is written for process and quality engineers in chemical and continuous-process plants. The examples use assay, active content and impurity specifications, and every number in them is illustrative.
For all four capability indices, including Pp and Ppk, see Cp, Cpk, Pp and Ppk explained.
Cp vs Cpk at a glance
Cp compares the width of the specification with the spread of the process. Cpk compares the distance from the process average to the nearer specification limit with half the spread of the process.
Cpk = min [ (USL − μ) / 3σ , (μ − LSL) / 3σ ]
USL and LSL are the upper and lower specification limits, μ is the process average, and σ is the process standard deviation. Specification limits come from the customer or from engineering. Control limits come from the process’s own history, and the two should never be confused; see control limits vs specification limits.
| Cp | Cpk | |
|---|---|---|
| What it compares | Specification width against process spread | Distance from the average to the nearer limit against half the process spread |
| Uses the process average | No | Yes |
| Works with a one-sided specification | No | Yes, as Cpu or Cpl |
| Can be negative | No | Yes, when the average of the process is outside the specification limit. |
| A low value means | The process is too variable for the specification | The process is too variable, off-center, or both |
Why is Cp always greater than or equal to Cpk?
Cpk can never exceed Cp because Cp is the average of the two one-sided capability indices and Cpk is the smaller of them. The NIST/SEMATECH e-Handbook of Statistical Methods defines the upper and lower indices, Cpu and Cpl, and shows that Cp equals their average while Cpk equals their minimum:
Cpl = (μ − LSL) / 3σ
The minimum of two numbers cannot be larger than their average. The two are equal only when Cpu and Cpl are equal, which happens when the average sits exactly at the midpoint of the specification.
The same handbook gives a second form that makes centering explicit: Cpk equals Cp multiplied by (1 − k), where k is the distance between the process average and the specification midpoint, scaled by half the specification width.
k = |m − μ| / [ (USL − LSL) / 2 ]
m = (USL + LSL) / 2
When the process is centered, k is zero and Cpk equals Cp. As the average moves toward a limit, k rises and Cpk falls. At the limit, k is 1 and Cpk is zero. Past the limit, Cpk turns negative. A negative Cpk means the process average itself is out of specification, so for a symmetric distribution more than half of the output is outside the limit.
What does the gap between Cp and Cpk tell you to fix?
A healthy Cp with a low Cpk means the process can meet the specification but is aimed at the wrong place. A low Cp means aiming will not help, because the spread is too wide for the specification wherever the average sits.
Take two processes making the product to an active content specification of 98.0 to 102.0%. The numbers are illustrative.
| Process A | Process B | |
|---|---|---|
| Average | 101.0% | 100.0% |
| Standard deviation | 0.4 | 0.8 |
| Cp | 1.67 | 0.83 |
| Cpk | 0.83 | 0.83 |
| Expected out of specification (normal distribution) | About 0.6%, all above the upper limit | About 1.2%, split between both limits |
| Where to start | Move the average | Reduce the spread |
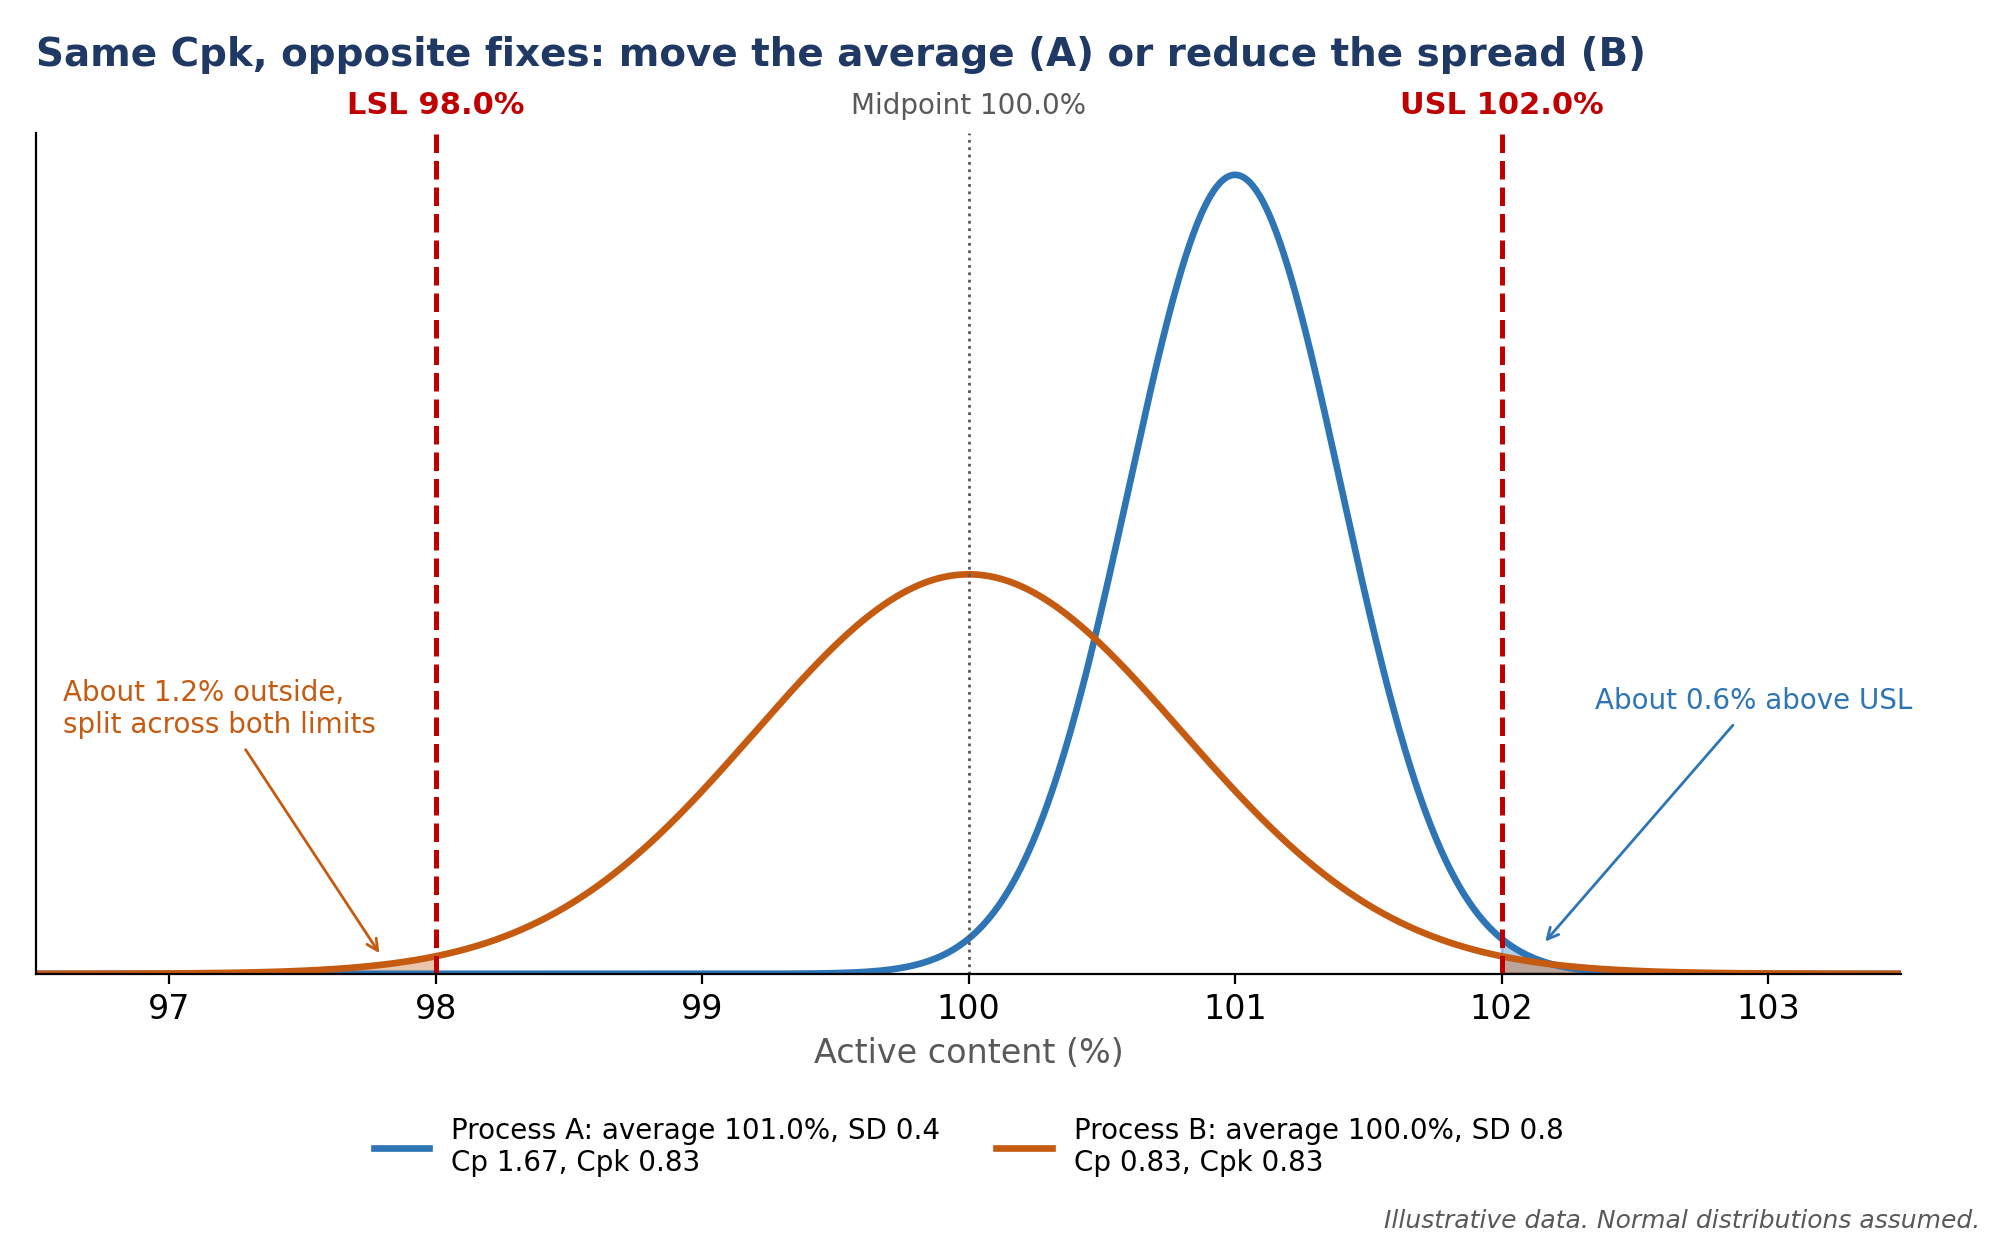
A report that shows only Cpk ranks these two processes as equal. They need opposite work. Moving Process A’s average to 100.0% raises its Cpk to 1.67 and cuts the expected out-of-specification rate to under one part per million. Process B is already centered, so centering has nothing left to give. Its standard deviation has to fall from 0.8 to about 0.5 before Cpk reaches 1.33.
The table shows one more thing Cpk hides. Process B loses product on both sides of the specification, roughly twice as much as Process A, and the matching Cpk values give no sign of it. Cp is the number that reveals it.
On a chemical process, the two fixes usually differ in cost and in who owns them. Centering typically means making a change to a setpoint, a recipe, a feed ratio or a blending target. High variability or spread can result from raw-material variability, equipment condition, control loop tuning, or sampling and measurement variation, and reducing it is usually an engineering project. Before starting that project, check how much of the measured spread comes from the lab method rather than the process.
| What the report shows | What it means | Where to start |
|---|---|---|
| Cp meets your target, Cpk does not | The process is off-center | Find why the average moved before adjusting the setpoint, so the adjustment corrects a cause instead of chasing noise |
| Cp is below your target | The spread is too wide | Reduce variation; centering alone cannot reach the target |
| Both meet your target, with a large gap between them | The process is capable but aimed off-center | Check whether the offset is deliberate (see below) |
One-sided specifications: when Cp does not exist
When a characteristic has only an upper or only a lower limit, such as an impurity maximum or a minimum assay, Cp cannot be calculated, and capability is reported as Cpu or Cpl. Cp needs a specification width, and a one-sided specification does not have one.
Take an impurity specification of no more than 0.50%, with a process average of 0.20% and a standard deviation of 0.08%. The numbers are illustrative.
Cpk equals Cpu here, because there is no lower side to compare against. A spreadsheet or template in which someone typed zero as the lower limit will still report a Cp. Treat that Cp as an artifact of the setup: it describes a specification the customer never wrote.
For one-sided specifications, Montgomery’s Introduction to Statistical Quality Control recommends minimum values that the SAS/QC documentation summarizes: 1.25 for an existing process, 1.45 for a new process or a critical variable on an existing one, and 1.60 for a critical variable on a new process. The impurity example sits exactly at the minimum for an existing process.
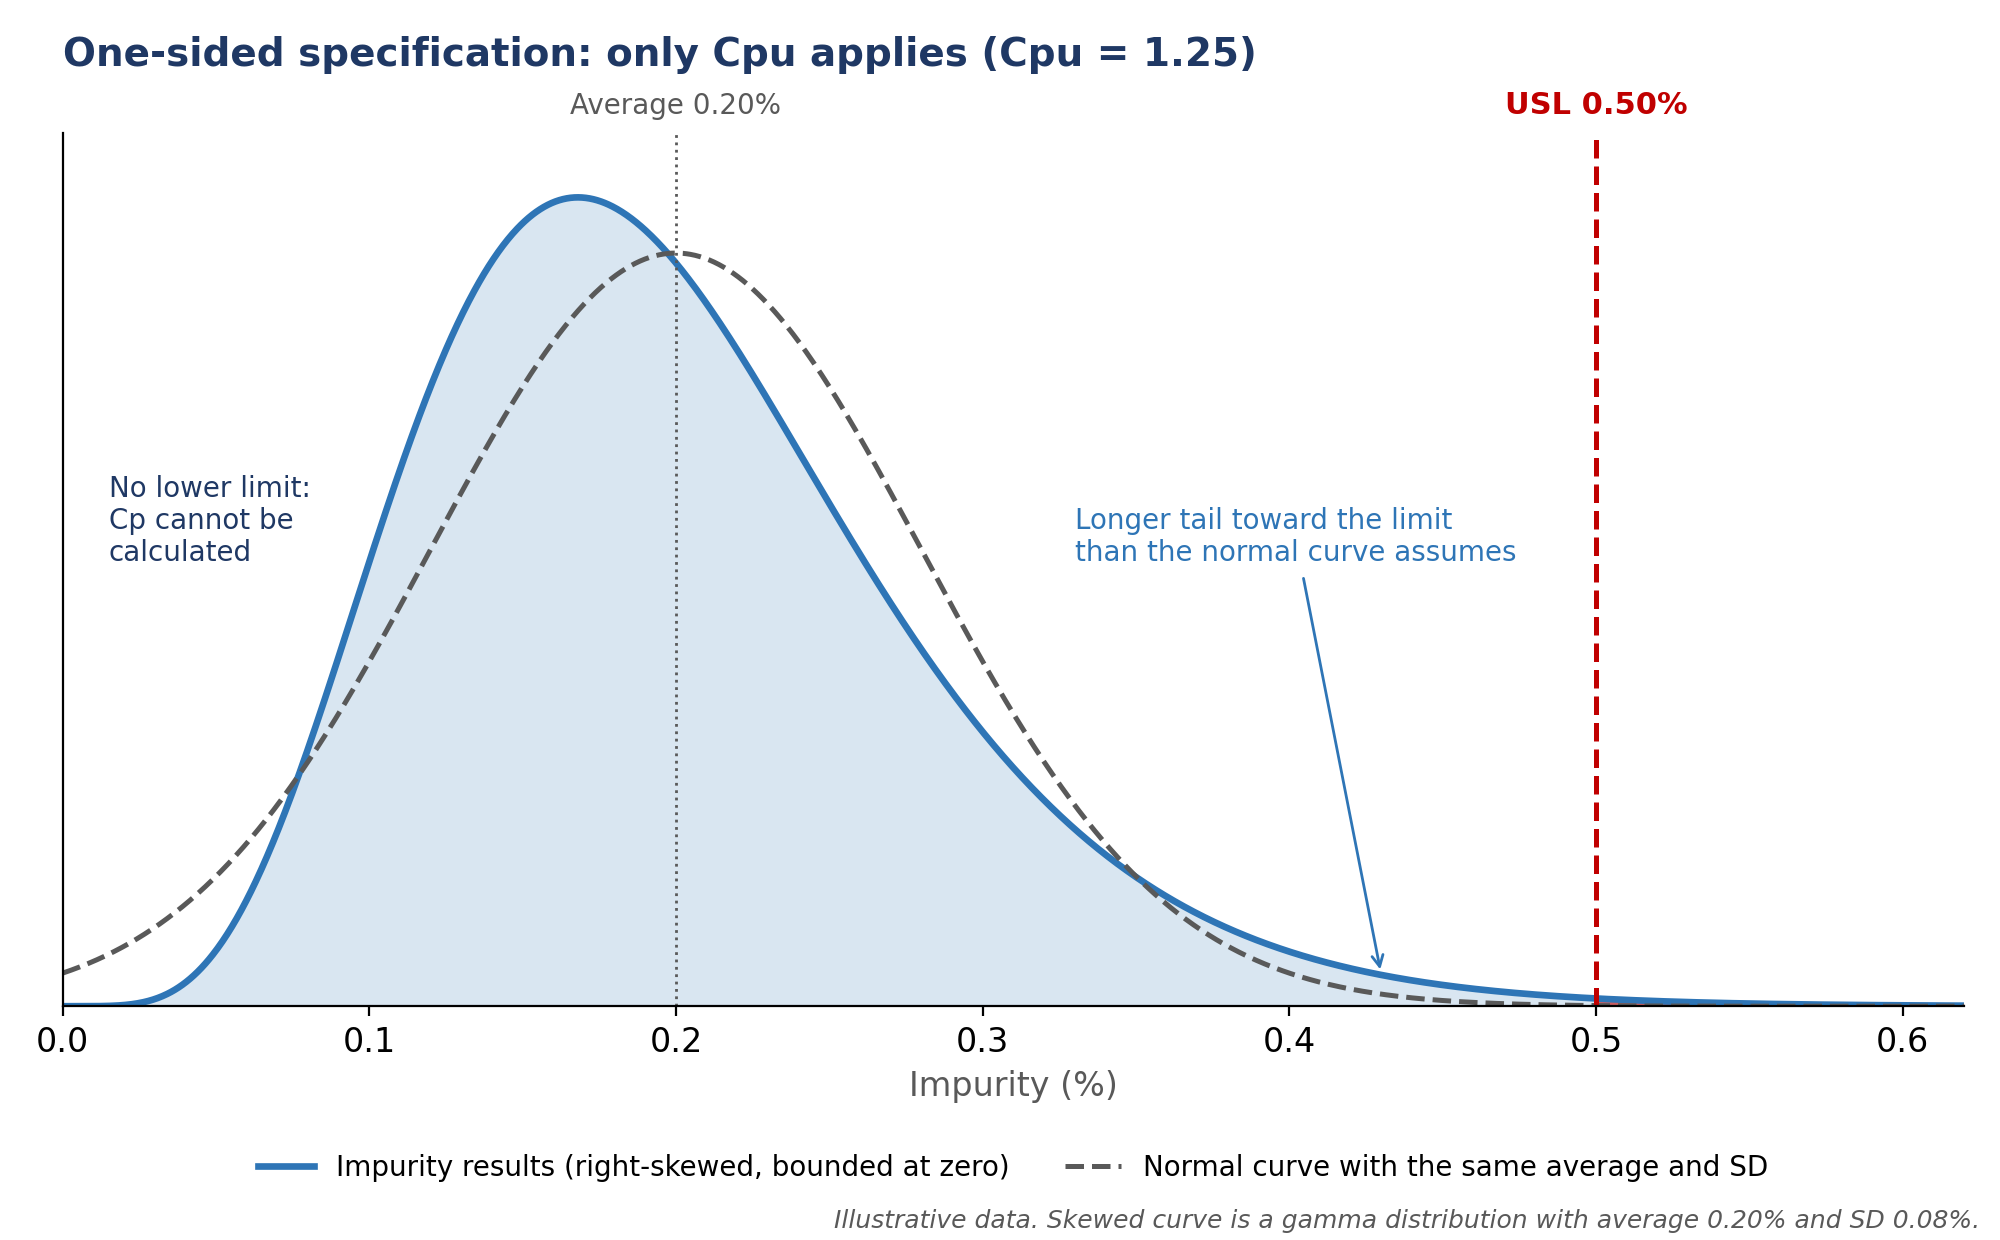
One-sided characteristics also carry a normality problem. Cp, Cpk and Cpm all assume the data are normally distributed. Impurity results are bounded at zero and are often skewed to the right, which puts the long tail on the side facing the limit that matters. A Cpu calculated as if the data were normal can then overstate capability. NIST lists the remedies: transform the data toward normality, for example with a Box-Cox transformation or Johnson transformation, or use percentile-based indices designed for non-normal data. Whichever you use, the report should say which method produced the number.
When the process runs off-center on purpose
If the target is not the midpoint of the specification, a gap between Cp and Cpk may reflect a decision rather than a fault. Plants sometimes aim active content toward one side of the specification deliberately, for example to allow for loss during storage or shipping.
Reread Process A with a target of 101.0%. Its Cpk is still 0.83, and it is still accurate: the average sits 2.5 standard deviations below the upper limit, and about 0.6% of output would fall above it. What changes is the conclusion. Recentering to 100.0% would raise Cpk and undo a choice someone made about the product.
When centering on a target matters more than centering in the specification, NIST describes a third index, Cpm, which measures variation around the target value instead of the specification midpoint:
Here T is the target value. For Process A with a target of 101.0%, Cpm is 1.67: the process runs on target with the spread it has. Cpk still reports 0.83 at the upper limit. Both are true. If 0.83 is not acceptable, the options are to reduce the spread or to revisit the target. Record the target and the reason for it alongside the capability report, so the next engineer does not “fix” the offset.
When Cp and Cpk disagree for the wrong reason
If a capability report fails any of three arithmetic checks, the disagreement comes from the calculation and says nothing about the process:
- Cpk is no larger than Cp.
- Cp and Cpk are equal when the average is at the specification midpoint.
- Cp equals the average of Cpu and Cpl.
A report that fails one of these used different inputs for the two indices. A likely cause is a different estimate of the standard deviation. Cp and Cpk should both use within-subgroup variation. If one index uses within-subgroup variation and the other uses the overall standard deviation of all the data, the report is comparing Cp with Ppk under the wrong label. Cpk vs Ppk explains the two estimates and when each applies.
Two conditions come before any of this arithmetic. The process has to be stable: capability indices, as NIST frames them, compare the output of an in-control process with its specification limits, so check the control chart for special-cause variation first. The sample also has to be large enough. NIST puts the working minimum at about 50 independent values, and says capability studies generally need at least 100.
Checking capability in NWA Quality Analyst
NWA Quality Analyst calculates capability alongside the control chart, from production data it reads directly from your historian, LIMS or other database. Its calculation engine is validated against published ASTM reference data and revalidated whenever computational code changes, so the numbers on a capability report can be checked against a known reference instead of taken on trust. It reports Cpu and Cpl alongside Cp and Cpk, and shows which standard deviation estimates each index used.
Schedule a demo to see how Quality Analyst reports capability on a process like yours.
Before you act on a capability number
Check the arithmetic first. If it holds, read the gap: a healthy Cp with a low Cpk points to centering, and a low Cp points to spread. Before recentering anything, confirm that the target really is the midpoint.