Statistical Process Control (SPC) is a necessary part of modern chemical processing. The software chosen to collect quality data and produce control charts will determine whether SPC is an awkward task or a smoothly operating part of the process. The right software must satisfy all basic chemical production SPC needs, while providing additional capabilities which make it the core of a well run and effective quality system.
The successful implementation of SPC begins with the selection of the tools and methods best suited to the company's quality goals. Because manual charting can be burdensome and time-consuming, using specialized SPC software is preferable for routine charting and essential for process improvement studies.
Numerous PC-based SPC software packages are readily available. Most, however, were created for discrete manufacturing such as auto parts machining, and consequently are limited in their application for other manufacturers. Chemical processors evaluating SPC software need to be aware of these shortcomings when making their selection:
- Limited usability Can the software handle both process and laboratory data? Will you be able to select one package to meet the needs of all users?
- Data limitations Can descriptive, measurement, and defect data be viewed in and analyzed from the same data file?
- Operator requirements Can routine charting tasks be automated to reduce training time? Is unattended operation possible?
- Rigidity Can charts be configured to precisely meet internal QC needs and still meet customer and regulatory reporting requirements?
- Data isolation Can the software easily collect process data? Can it accept instrument data? Can it share or exchange data with corporate or plantwide information systems?
- Vendor awareness Are the software developers knowledgeable about the issues and special requirements of the chemical processing industry?
Northwest Analytics (NWA) made the needs of the chemical processing industry a special focus. Because much of NWA’s development staff began their careers in laboratory and chemical processing environments, they understand the needs and challenges faced in implementing SPC in the industry. As a result, NWA Quality Analyst is the world leader in SPC software for chemical processors ranging from small independents to major multinationals. Their applications include internal QC and process improvement, vendor certification, and regulatory compliance.
The following examples illustrate the value of applied SPC. Each describes a real-world situation encountered by a NWA Quality Analyst user.
Example 1—Monitoring Yield
NWA Quality Analyst provides the comprehensive SPC capabilities required for monitoring process operation and improvement. For example, a chemicals producer sought to improve yield through process improvement at a recently acquired urea plant. To do so, an improvement team used process optimization software in conjunction with NWA Quality Analyst.
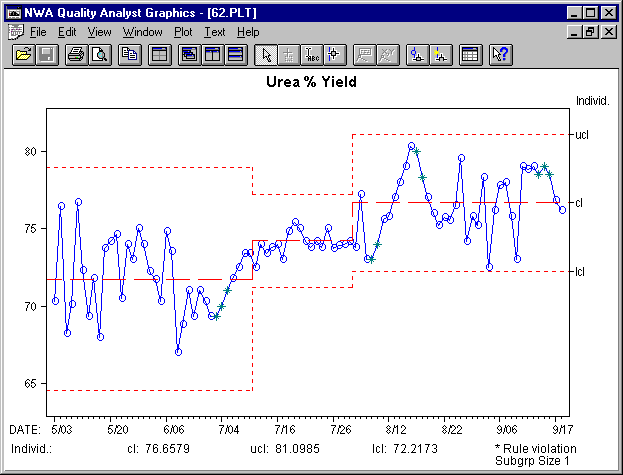 The control chart in Figure 1 tracks the yield in the urea plant for the duration of the process improvement project. The first section of the chart shows yield prior to July 10. Possible areas of concern include the capacity of a valve controlling ammonia flow and the control system for steam feed. Consequently, the team developed and tested several improvement models.
During the testing phase, yield increased by 2.4%, indicated in Figure 1 by the second region of the chart (indicated by moving control limits). Further study of the new production data suggested the best suited model for production. The period after July 30, represented by the third region of the chart, is the phase of implementation of that model. The yield in this final region represents a 6.0% increase over original conditions. Note that the process is in statistical control at all times. This is essential if a process is to be modified and the results understood.
The process study required SPC software that combined sophisticated presentation capability with relative ease of use. With NWA, presenting a control chart with control limits calculated independently for the different phases of a project is both fast and straightforward. Not only can NWA provide sophisticated reporting and analysis, but the average chemist or engineer can take advantage of these capabilities with minimal training and experience.
Example 2—Product fill weight
Many times, customers use the container as it comes from the plant as a unit measure in their formulas. By applying SPC properly to package fill weight or volume, manufacturers can make a significant difference in the profitability of a facility.
A titanium dioxide (TiO2) producer supplies a paint manufacturer its product in 50 lb. bags used as a unit measure in paint batch operations. Consequently, any variation in bag fill weight affects the customer’s finished product.
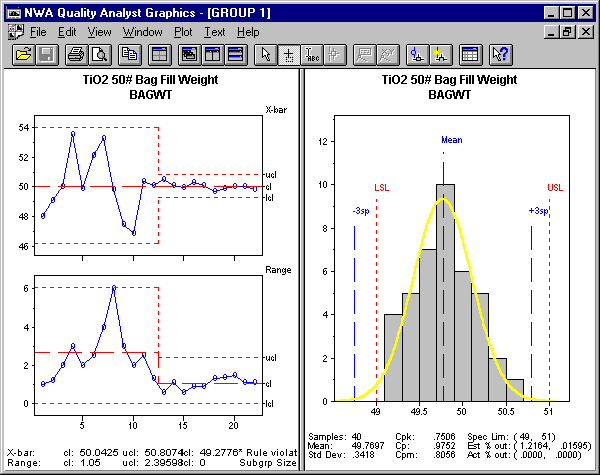 During routine process improvement studies using Quality Analyst, the TiO2 producer discovered a ±7-lb. variation from the nominal fill weight, falling well outside the paint manufacturer's accepted specifications, even though the process is in statistical control. (See Figure 2.) This suggests that the problem is with the bag filler and not the result of some external influence. Further analysis revealed the primary source of variation to be the bag-filling machine. After machine adjustments and operator training, the TiO2 producer reduced fill weight variation to the published 2% capability of the filling equipment.
The histogram in Figure 2 also shows that while the process meets specifications, it is not "capable" according to its Cpk. This implies that new problems with fill operations will arise if the customer tightens the specifications and that further process improvement is desirable.
Multiple Head Filling
While the standard Shewhart X-bar chart is the right choice to monitor a simple filling operation, multiple head filling systems have special requirements. Multiple head systems are an example of a "family" process where the overall packaging process also includes a collection of independent sub-processes such as individual fill heads. If an X-bar chart were used to monitor a 24-head fill machine, it would treat the 24 fill weights as a subgroup and mask the behavior of the individual fill heads. Local variations will affect the chart only when included, by chance, as part of the sample. The probability of locating a problem becomes wholly unpredictable.
To adequately deal with this analytical challenge, NWA provides Median/Individual Measurements (M/I) charting as an effective strategy for dealing with family processes. The M/I chart combines the elements of the median chart with the individual measurements chart. As a result, the global process is shown as the median line and individual values are treated as points which are uniquely identified if they go out of control.
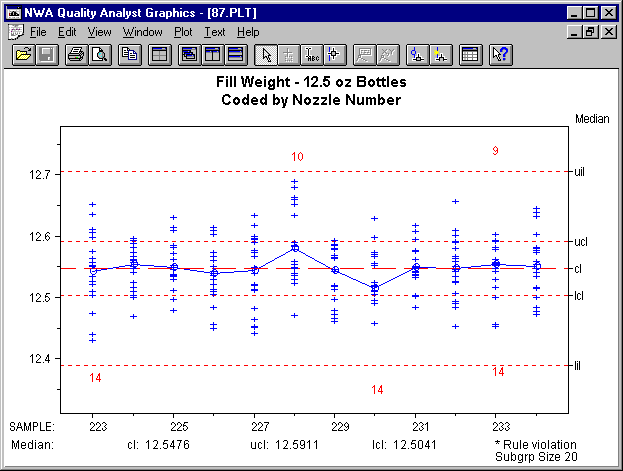 The example shown in Figure 3 is taken from a contract filling operation for car care products. The solution is being filled on a 20-head filler line. One can readily identify out-of-control fill heads—for example number 14. The offending fill heads can be addressed with no alteration to the statistically in control overall process.
Process Capability and Impurity Analysis
Chemical manufacturers are increasingly required by their customers to report process capability to show how well a process can meet specifications for their product's key parameters. Process capability is usually reported as a histogram with a "normal" curve overlay.
Process capability statistics, termed "indices," are generally based on a ratio of the product's specifications to the process variation (usually expressed as +/-3 standard deviations based on the distribution). Of the many indices used to denote process capability, the most common is Cpk, which is typically required to be at least 1.3 and often at least 1.7. The higher the ratio, the more room between the process and its specifications, and therefore, the more capable the process.
This form of statistical analysis is routinely required in discrete manufacturing, where it is generally well suited for the types of processes and measurements involved. In industries such as chemicals, pharmaceuticals, and foods, process capability can be more difficult to interpret. The problems become acute when measuring low-level impurities.
For chemicals producers, the problems begin with how the Cpk calculation is usually represented, requiring both upper and lower specifications. Impurities usually have an upper specification ("not to exceed") but no lower specification (the goal is usually zero). Many QC workers in the chemical industry will define a lower specification of zero in hopes of being able to use the common equations for Cpk. The results can appear disastrous even in a process that is operating properly, since most of the data is close to what has been defined as the lower specification.
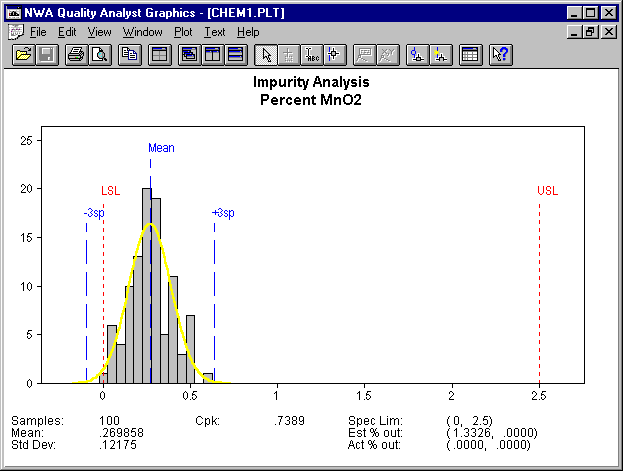 In this example, a minerals producer has a product with a requirement of keeping Manganese Oxide (MnO2) below 2.5%. The QC staff first set specifications of 0.0 to 2.5 and attempted a process capability analysis. The resulting histogram looked improbable. With an unacceptable Cpk of 0.7389, the "normal" curve overlay (estimated from the data) extended below zero where no actual analytical results are possible. (See Figure 4.)
The poor statistical results are all due to the way the chart was configured and in no way related to the process itself. Because no actual data can be found below zero, the data is said to be "truncated". The solution is to change the methods used to estimate the distribution and calculate the capability statistics. Quality Analyst provides a highly configurable process capability report, with a wide range of calculation and formatting options that allow the capability report to more closely match the process.
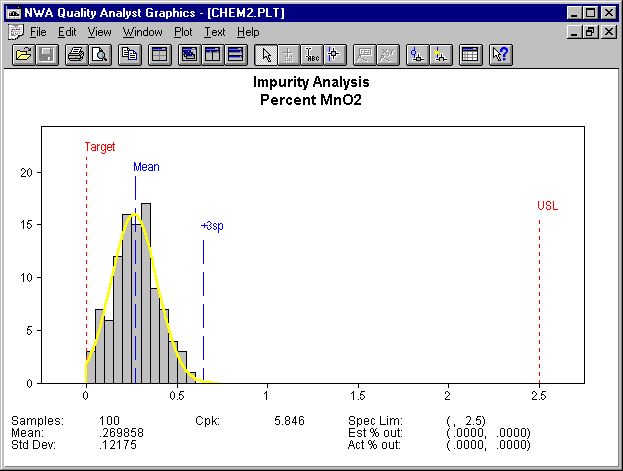 The result can be seen in Figure 5, where the Lower Specification was replaced with a Target of zero. The distribution type was changed from "Normal" to "Truncated", with the "truncation" point set at "0." Last, the histogram bars display was shifted so no part of a bar would appear below "0." The specifications, estimated distribution, and histogram display format now all match the characteristics of the process; the presence of the target allows Cpk to still be calculated even without a lower specification. Note the significant improvement in the Cpk (5.846 vs. 0.7389) and how much better the graph and resulting statistics represent the process.
Application Specific Charts
NWA closely tracks its target industries and works with customers to provide the solutions needed for their particular applications. As a result, NWA Quality Analyst provides several industry and application specific methods such as Exponentially Weighted Moving Average (EWMA).
Short Run charts were developed to handle batch oriented systems where different products or formulas are produced by the production system. The actual chart is based on variation from nominal values for each product and charts the performance of the underlying system.
Integration
NWA Quality Analyst can transfer data from databases and instruments either by direct file transfer or by using Microsoft standard Open Database Connectivity. NWA Quality Analyst can also automate charting routines with its macro-like script language. This combination greatly simplifies the task of producing SPC charts wherever and whenever needed. When the plant uses an information system to maintain production data, access to the data for reporting and analysis can be a problem. NWA designed NWA Quality Analyst and NWA Quality Analyst Server to flawlessly integrate with standard database systems and provide automated SPC charting. The NWA effectiveness in this role is demonstrated by the fact that several vendors of laboratory and manufacturing software incorporate NWA software for their analytics capability.