Today's manufacturer faces an era where the problem is no longer one of not being able to collect enough data on manufacturing processes, but how to effectively use the massive volume of data collected. It is generally accepted that process based manufacturing intelligence is the best path to effective manufacturing enterprise management.
Traditional Quality and Specification Analysis SPC
Statistical Process Control (SPC) is a time honored and well demonstrated method of process management. Everyone who has studied modern manufacturing knows of Dr. Deming and his early work establishing SPC as a standard practice in postwar Japan. SPC has long been used for measuring and monitoring quality by the Quality departments and labs of most industrial manufacturing facilities.
SPC has undergone periodic recasting and updates, such as Continuous Process Improvement (CPI) and Total Quality Management (TQM), as we learn more in each cycle of popularity. Certainly SPC is a key part of the Six Sigma and Lean Six Sigma programs used by many manufacturers.
Many of these SPC applications provide data analysis either “after the fact”, in the case of quality monitoring in a lab based on product samples at the end of a production process, or somewhat removed from the immediate “actionable decisions”, in the case of the Six Sigma processes.
Typical applications of the traditional SPC methods include successful quality/process management functions such as:
- Routine SPC Reporting
- Process Monitoring and Improvement
- Analytical Method QC in Laboratories
- Regulatory Compliance
- Supply Chain Customer Certification
Real-time Operational Decision Support SPC Analysis
While the SPC analytical methods have met the challenge in these functions, it also is the right tool for better analysis of available data. The time based, comparative analysis and visual presentation of the analysis that are unique to the SPC methods, enable manufacturers to better understand their processes and, more importantly, to take immediate action based upon the analysis of the data. SPC is the appropriate technology and methodology to meet the current needs of manufacturing that call for data analysis to provide:
- Ability to measure ROI on systems investment
- Timely and effective analysis summaries and reporting
- Predictive capability
- Identifiable benefits (lower costs, higher yields)
- Support immediate actionable decision processes based upon results
- High confidence to make process change for improvement
- Incorporation into a proactive process improvement program
- Make it easy to get specific, role-based results for individual informational needs
- Reduce complex calculations of aggregated data to meaningful and measurable information with context
- Immediately measurable results of actions taken
If the demand is for better analysis, then real-time, actionable, decision support analysis are the rally points. Again, the SPC techniques, methods and characteristics lend themselves to these points. The goal is to provide the operator with real-time SPC analytics to quickly identify “out of control” parameters. This real-time visualization can take the form of a SPC application embedded within an HMI display or a dedicated SPC data collection and analysis system on the manufacturing floor.
In the HMI applications, SPC has often been viewed as an accessory function. However, the requirement for better process management and improvement requires that fully developed SPC analytics and visualization are an embedded function within the HMI. This facilitates the most effective real-time data capture and analysis, provides the operator with immediate access to the visual presentation of the analysis, allows a mechanism for the operator to document preventative or corrective actions taken, and supports the role of the HMI as a feed into integrated manufacturing intelligence.
SPC is the fundamental tool to make more effective use of all the data in historians, MES and ERP systems. It also allows for the reduction of complex, specialized process data into graphic visualizations which operations and management can quickly understand and use to take informed action.
Some of the particular derived benefits of SPC-based real-time Decision Support are:
- Robust, easy to understand, high level of confidence
- Identify, verify and reduce sources of variation
- Analyzes ongoing and immediate variation, not final product quality – process control not product control
- Applies to both the process and the product
- Detects changes, shifts and unusual events
- Separates signals from noise
- Identifies causes of excessive variation
- Monitors real-time results of continuous process improvement activities
- Predictive problem detection on a stable process
- Provides tool for documentation of compliance with customer supply chain requirements
SPC Based Manufacturing Analytics
Along with the demand for better data analytics is the desire to integrate production data and analysis with business data and analysis. This is the core concept of manufacturing intelligence which provides a better understanding of complete corporate performance.
SPC-based Manufacturing Analytics is statistical and rule based, providing the aggregation, analysis and role-based visualization and reporting of manufacturing data that enables users to better understand and improve their processes, identify and reinforce best practices, react quickly to process events, and anticipate potential problems before they affect product quality, yield, or cost. The key differentiating elements of Manufacturing Analytics methodologies for analyzing data are:
- Statistically based
- Focused on role based analysis and reporting
- Identifies significant events, separating out “noise”
- Emphasis on visual presentation technique to enable quick analysis
- Supports both reactive and predictive behavior
- Easy enough to be implemented, maintained, and used by existing plant personnel
- Aggregates data from different sources while preserving statistical validity
- Supports the ISA-95 Production Performance Analysis Activity Model, which outlines the need for robust systems, methodologies, and tools to improve the ability to make very informed decisions based upon extensive and varied analysis functions.
What has been the result of the merging of these two levels of business analysis and manufacturing analysis are parameters used to monitor the overall status and performance of an operation or enterprise. These are expressed as Key Performance Indicators (KPIs), which are usually a single parameter consisting of an aggregation of financial, operational, and measured parameters to provide a meaningful and reliable KPI variable. These variables are often monitored for a “good” or “bad” status in some sort of web-based visualization tool, such as a portal or dashboard. The ability to contribute to or provision this web-based visualization function is a key component of the new analysis opportunity.
Manufacturing Analytics methodologies would allow for a system to be created that monitors the stability and change of all the parameter components contributing to the KPI, which would allow the detection of a change in one key KPI component before the KPI itself shows to be out of range. The visual presentation of this detection could then be displayed not as just a “good” (green) or “bad” (red) status, but even as a “potentially getting worse” (yellow) status. Existing KPI analysis and reporting systems do not have access to all the parameters or the ability to represent all the components in this fashion, such that operations and management can quickly identify, or even predict, early signs of detrimental change to take action against.
Choosing an SPC Analysis Platform
A good SPC platform should be able to accommodate all three levels of analytics outlined here for the manufacturing environment.
- Traditional – SPC Quality and Specification Analysis
- Emerging – Real-time Operational Decision Support SPC Analysis
- New – SPC Driven Manufacturing Analytics
Additionally, this platform must be architecturally structured to allow for growth and expansion around the different levels of need and phased implementation a manufacturer may require. This requires a modular and component based approach that allows easy integration into existing and disparate systems, with an open and standards based approach to accessing the data to be analyzed. A system that can provide this function of real-time SPC analytics, coupled with role specific, visual reporting, can support the full range of analytics and decision support for all levels from plant floor through management.
Case studies
The following examples illustrate how Manufacturing Analytics is being implemented to get real benefits and improve the operating process.
Flexible Packaging – Offline and online real-time SPC analysis supports continuous improvement program
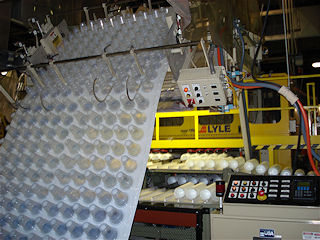
A large international flexible packaging manufacturer produces many different products of a similar form for various food industry customers. Product specifications are slightly different for each customer, and tight monitoring of the production against these specifications is necessary to meet supply chain requirements. Once the production line is running, the goal is keep the line running, and only make necessary changes to the equipment to ensure that the product remains within specs.
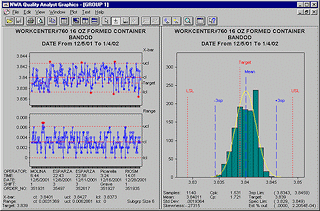
By using SPC analysis of electronically collected measurement samples on a real-time basis, and then presenting the results to the operator in a very basic “in or out” of specification/control visual display, the operators were able to detect and make appropriate adjustments to keep the production line running and achieve reduced variation and reduction in returned product.
The operators and quality inspectors have information directly available to them from this interface. They are able to view summary historic data, as well as real-time SPC charts to analyze the process. These role specific reports give the staff complete access to standard operating procedures and support uniform workflows.
SPC is used to establish process control limits and support quality control initiatives. Engineering uses the software for process studies and to work process capability into specifications. The approach is part of the continuous process improvement programs which reduce variation, decrease scrap, and reduce product overages.
As a result of proactively using SPC, the plant has been able to improve operations by limiting weight variation during the manufacturing process. Over the past two years, the difference between the target weights versus actual weight was measured and benchmarked. The measured results showed a cumulative cost savings of over $200,000 since the program started.
Food Safety – Using SPC Analytics for early prediction
 A poultry processing plant monitors regulated bacteria such as E. coli and Salmonella. When the pathogen level exceeds the limit, the required action is costly and time consuming. Exceeding the safe levels can happen quickly, with little time for corrective action. Setting arbitrary “reaction” limits can lead to a tradeoff between false positives and missing signals.
The fact that they actively use SPC and actively manage the process enables fast and informed response. Applying Manufacturing Analytics using SPC-based event and pattern rule violation detection results in early detection of an unstable process, predicting the likelihood of an event, and enabling corrective action and process improvement to prevent reoccurrence.
By using continuous process improvement, the poultry plant was able to develop very high capability production (Cpk = 12.2) with regard to pathogen levels. This provides a large amount of manufacturing head room. Because of this high capability process management, the plant has a substantial leeway when a process destabilizing event occurs, and can continue to produce wholesome food while the process engineers are returning the process to control.
Food Packaging – Using SPC Analytics to manage a co-packer’s performance
A dairy processing facility uses Analytics to monitor the fill weights of their products. They use control charts to monitor a KPI that indicates whether the fill weights fall within a Maximum Allowable Variation (MAV) ratio. This enables them to maximize the product yield while controlling the risk of MAV violation.
The dairy uses a co-packer to package some specialty products. The dairy qualifies the co-packer by using SPC to evaluate their process dependability and capability to meet specifications. Production fill weights are routinely collected and results reported to the dairy as part of their supply chain quality management.
Since both the vendor and customer are using the same analytics and charts, they can more effectively collaborate to improve the process and yields. In addition, the dairy can use the co-packer’s quality deliverables to manage their label weight regulatory compliance.
Industrial Gases – Integrated SPC Analytics Improve Customer Lot Acceptance and Support
A major industrial gas producer integrates both laboratory and control system data into an automated SPC based reporting system that improves both profitability and customer relations. In addition to process savings, the system has enabled customer quality awards and ratings and the cost savings from having no customer rejects in the past four years.
 The continuous process improvement helps both customer retention and is a key value provided to customers. For many customers, SPC and CPI performance are now part of the purchasing agreement. Customer communications uses web meeting places to share presentations, email, meet by teleconference, and focus on the SPC data to look for improvement.
This data management and analytic capability enables them to successfully answer customer inquiries. As the head chemist says, “He who has the best data wins. We have years of supplier product and calibration data, and when questions arise, we have the support we need to back up our processes.”
OEE - Using SPC to validate OEE calculations
SPC and process capability methods increase value and usability of OEE values. The OEE KPI can be treated like any other process parameter with trend and capability monitoring and analysis. Using SPC methods to analyze and chart the OEE values provides far more actionable information than a simple annunciator on the management dashboard. Not only does the control chart deliver more and better decision support on the OEE KPI, one can drill down and study the behavior of the individual OEE components, availability, performance and yield. This is illustrated in the white paper, "Applying Manufacturing Intelligence to OEE for Real-Time Decision Support."
KPI Component Analysis
A plant using large, continuous process ovens needs to develop a meaningful and reliable KPI consisting of financial, operational, and measured parameters to accurately represent the total energy costs. The existing KPI system was unable to monitor all the necessary component variables and visually display the KPI, such that operations could react to early signs of change.
By applying Manufacturing Analytics using SPC-driven, role-based visualization reporting techniques, the plant could create a system that monitored the stability and change of all the parameter components contributing to the Energy Consumption KPI, which allowed the detection of a change in one key KPI component before the KPI itself showed to be out of range.
Summary
Modern control systems, plant floor data collection, and laboratories generate large volumes of process data. Unless this data is analyzed and usefully reported to all the staff involved in production and plant management, it will not be useful for operational management decision making. Actively using SPC and Manufacturing Analytics enables this data to be effectively used to manage the enterprise. Tightly coupled analytics will make control systems a core component of 21st century process and enterprise management systems.