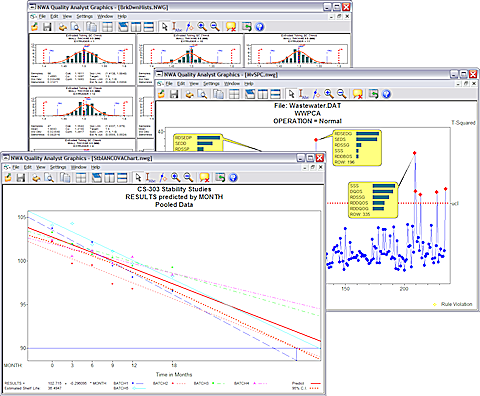
Integrated Multivariate SPC Charting and Analysis with NWA MvSPC™
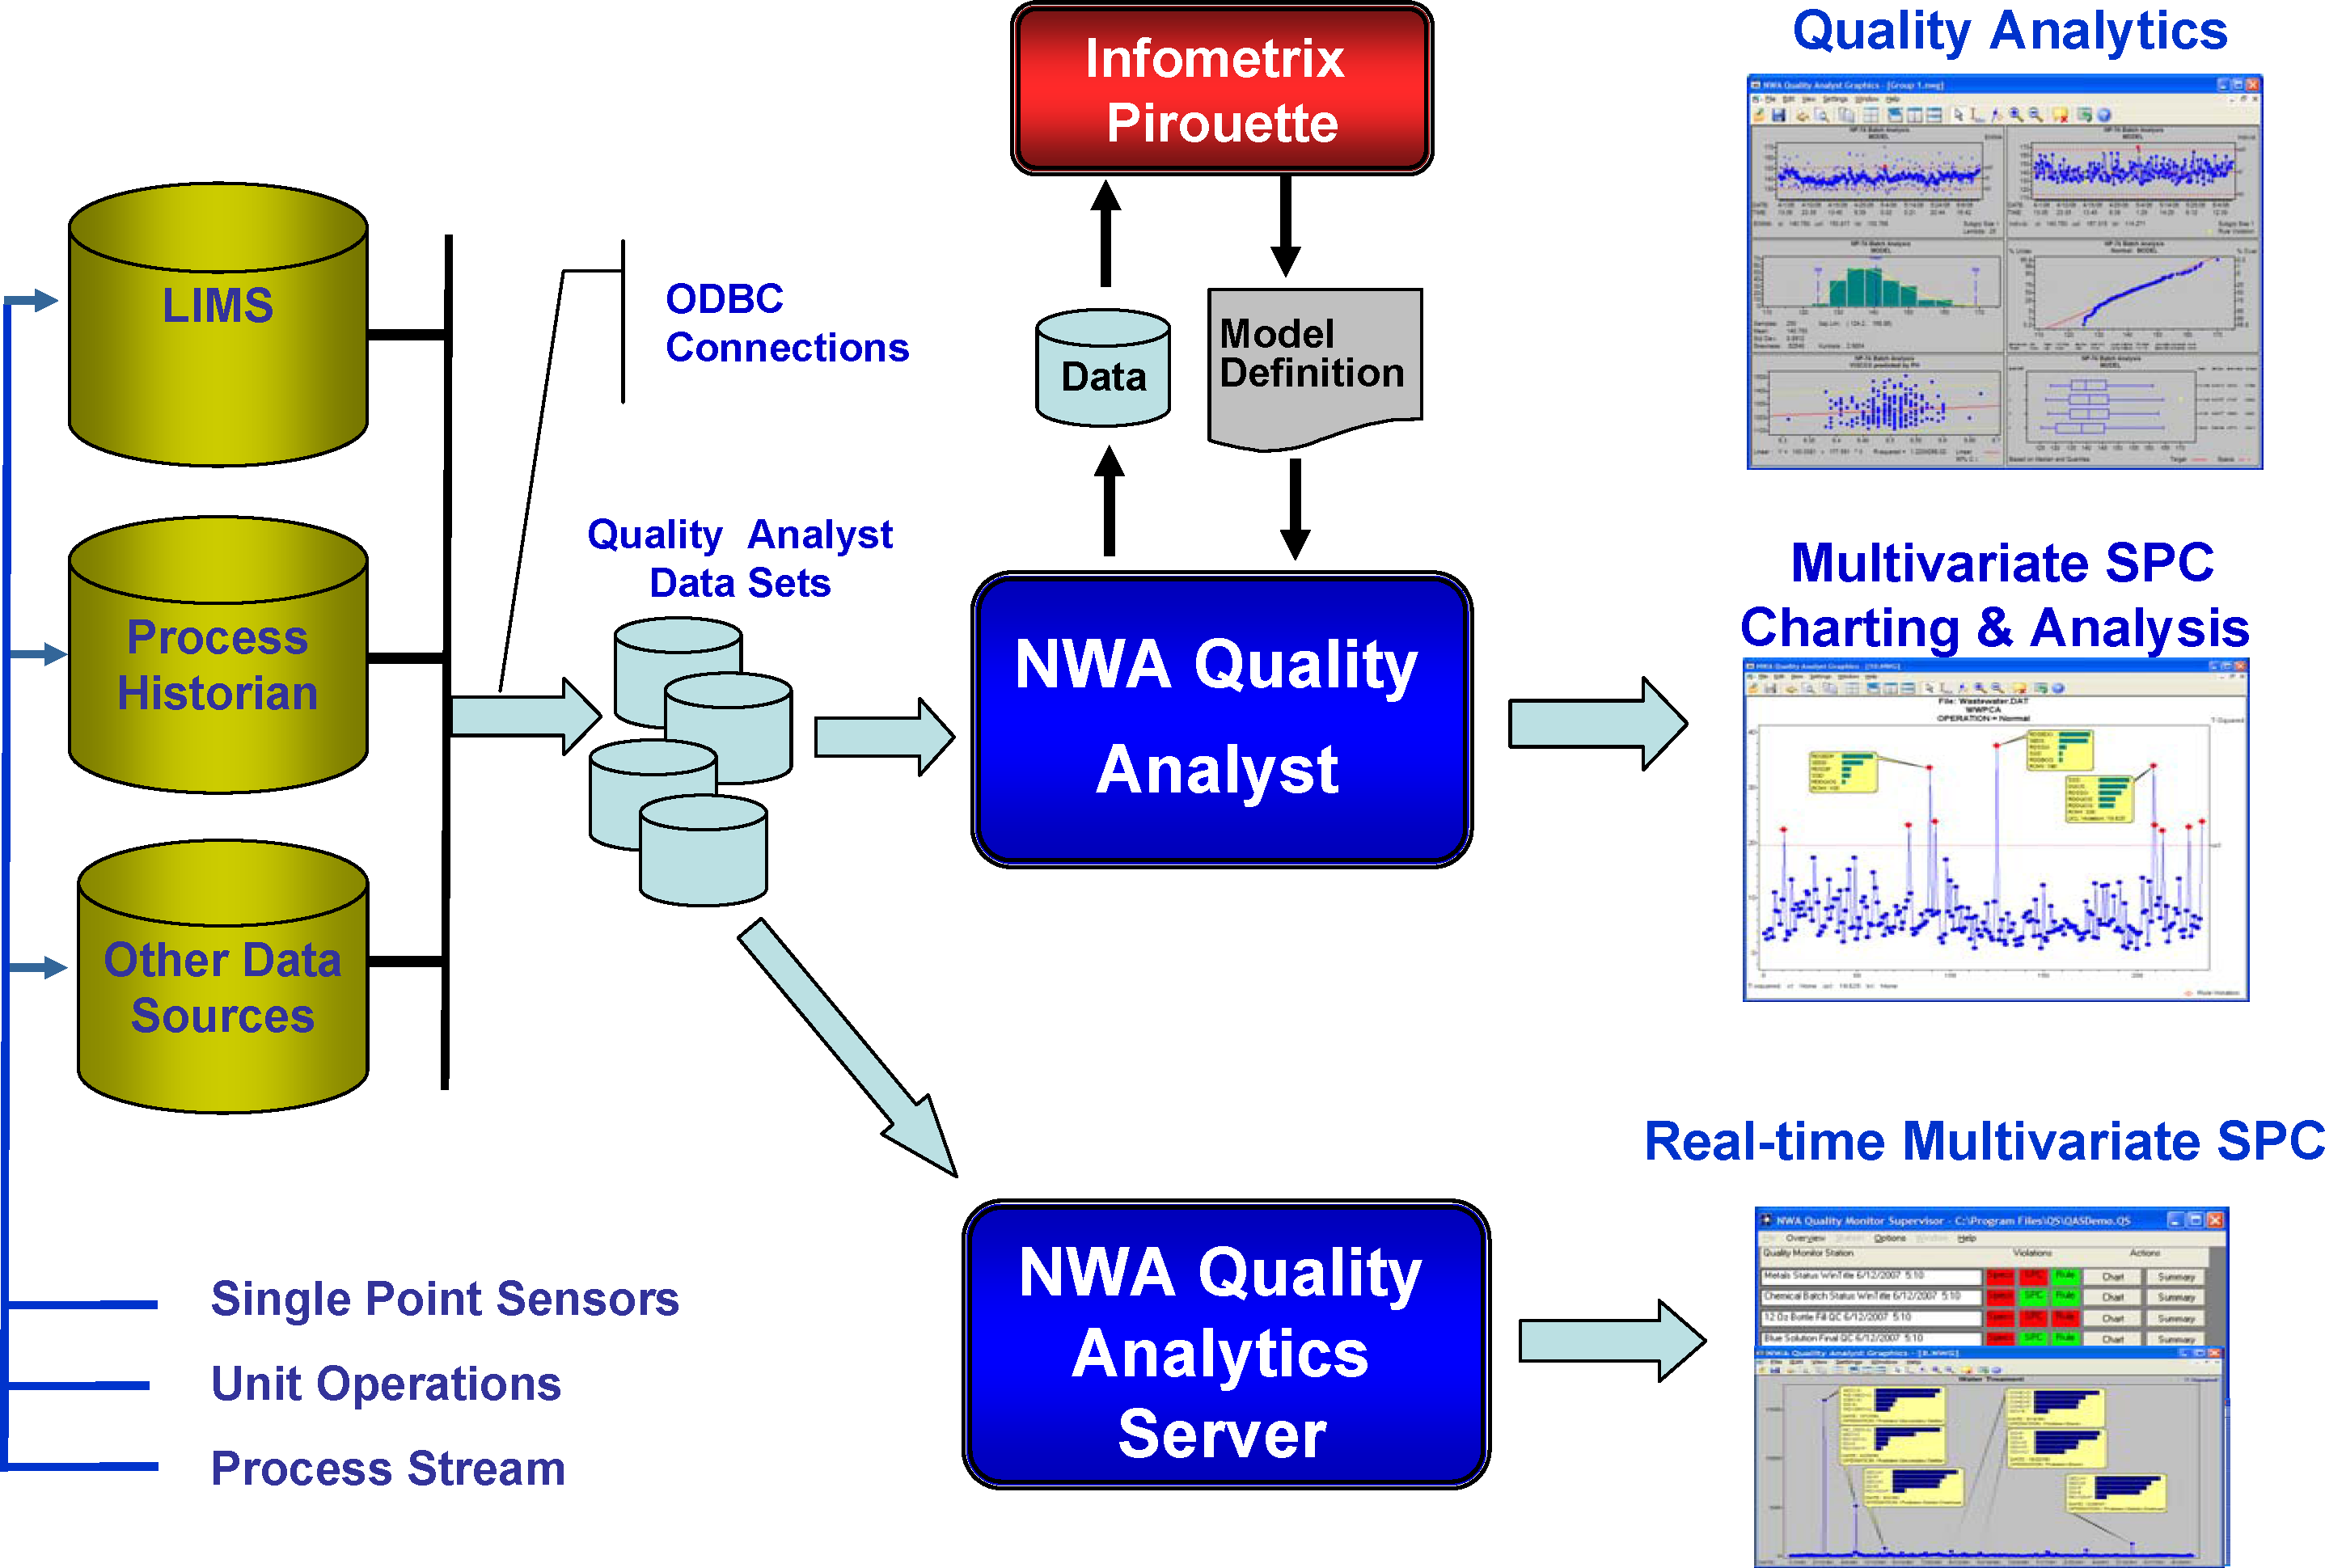
NWA and Infometrix have partnered to create fully integrated multivariate modeling and SPC charting that overcomes many of the barriers to the adoption of multivariate process monitoring and improvement techniques. NWA Quality Analyst’s new multivariate SPC module, NWA MvSPC™, combines with Infometrix Pirouette to simplify the data-collection, model-building, and deployment process for off-line and real-time applications.
NWA MvSPC™ provides:
- Fully integrated multivariate model building and SPC charting
- Easy connection to process and laboratory databases
- Simplified exchange of data and model definitions
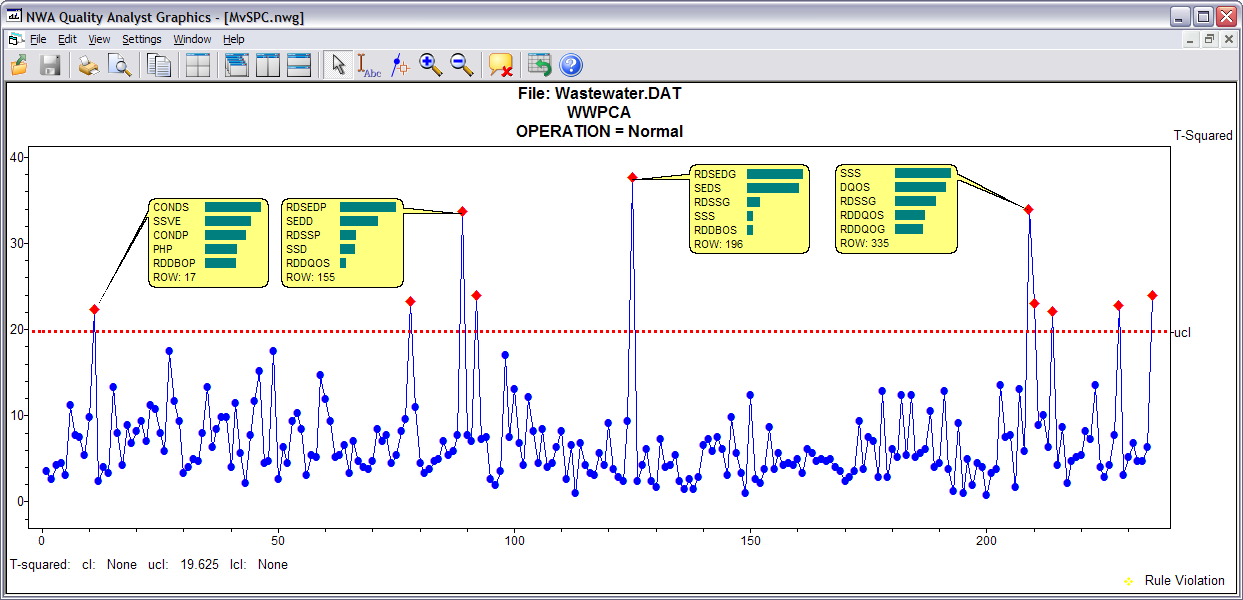
- Hotelling’s T-squared and SPE charts
- One-click access to Contribution Charts which identify important variables ranked by contribution
- Quality Analyst’s full range of analysis and reporting capabilities
- Real-time multivariate SPC using NWA Quality Analytics Server™
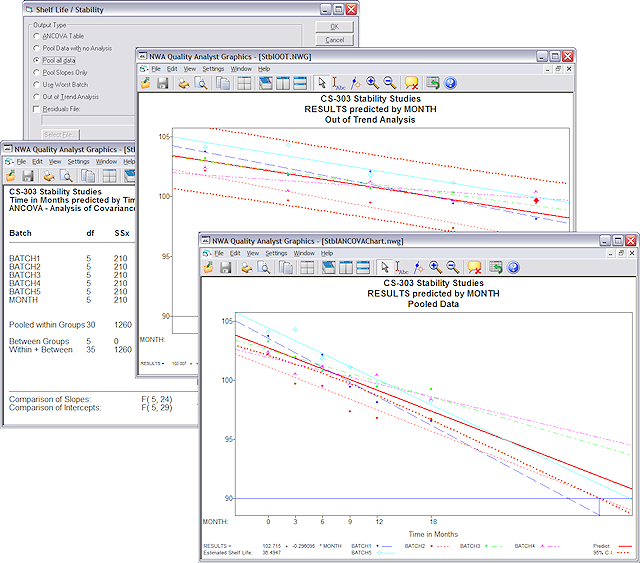
Stability/Shelf Life Prediction with NWA Stability Analytics™
NWA Stability Analytics ™ delivers the statistical analysis, charting, and reporting required for routine product-lot stability studies as described in the FDA/ICH guidelines.
This new module lets our Life Sciences users perform standardized stability analysis using the same software that provides their laboratory method QA/QC charting, replacing what is typically a multi application process, often performed by multiple staff.
 NWA Stability Analytics™:
- Meets FDA/ICH guidelines for stability analysis using ANCOVA
- Connects directly to LIMS and other study-management systems
- Simplifies configuration and maintenance
- Standardizes workflow and reporting
- Provides comprehensive stability statistics and charting
- ANCOVA statistics
- Tests for poolability
- Predictions using: Pooled data, Pooled slope, Worst case
- Out-of-trend detection
- Residuals analysis
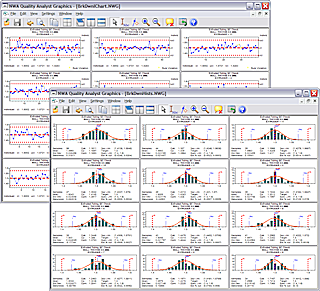
Data “Breakdown” Function
The new “breakdown” function automatically breaks data down for quick visual and analytical comparisons:
- Breaks data down by descriptive variables like Shift, Machine, Line, Customer
- Automatically breaks down dates by day, week, month, or year
- Instantly applies to all SPC and Process Capability charts
- Auto-scaling for fast, accurate visual comparisons
- Available for interactive and automated (Run File) charting
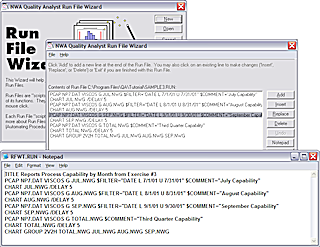
Enhanced Run File Wizard
The Run File Wizard now supports direct editing of Run Files within the Wizard and a “test mode” for checking Run File execution before saving. Being able to create, modify, and test Run files without leaving the Wizard makes automating analysis and charting easier and more productive.
New Graphics Viewer Functions
Quality Analyst 6.2 includes two Graphics Viewer enhancements that give you access to more information while viewing SPC charts:
- Electronic SOPs and other documents can be quickly accessed while viewing SPC charts. You can call up virtually any document or launch a web page by clicking the chart point of interest.
- A “quick link” function lets you click a chart point and immediately move to the appropriate row in the Data Set to view the data in context.