Startup Time – The Yield and Efficiency Thief
 Modern manufacturing strategy aims to make product to order. If the manufacturer is in a JIT supply chain this is even more critical. Properly done, this approach improves productivity, reduces inventory and cuts lead time.
Startup time increases production costs and overhead while not adding any value. Excessive startup time results in:
- Reduced yields - While the operators are stabilizing the process it is not making usable product. The scrapped product is a complete loss.
- Poor manpower and equipment utilization - Costs sunk into the make-ready cycle are not retrievable and are added to the total production costs.
- Non-productive cycles - If operators need to frequently stop and start the line, each episode reduces line availability and production throughput.
- Reduced OEE - Startup times have a strong negative impact on the Overall Equipment Effectiveness (OEE) rating of the production line. Each of the parameters in the OEE KPI (quality, uptime and throughput) is heavily impacted by startup and changeover time.
An important approach to reducing startup time and the associated waste is to incorporate SPC methods to drive down variation and improve capability. The following example illustrates how SPC methods can be successfully used to reduce startup time.
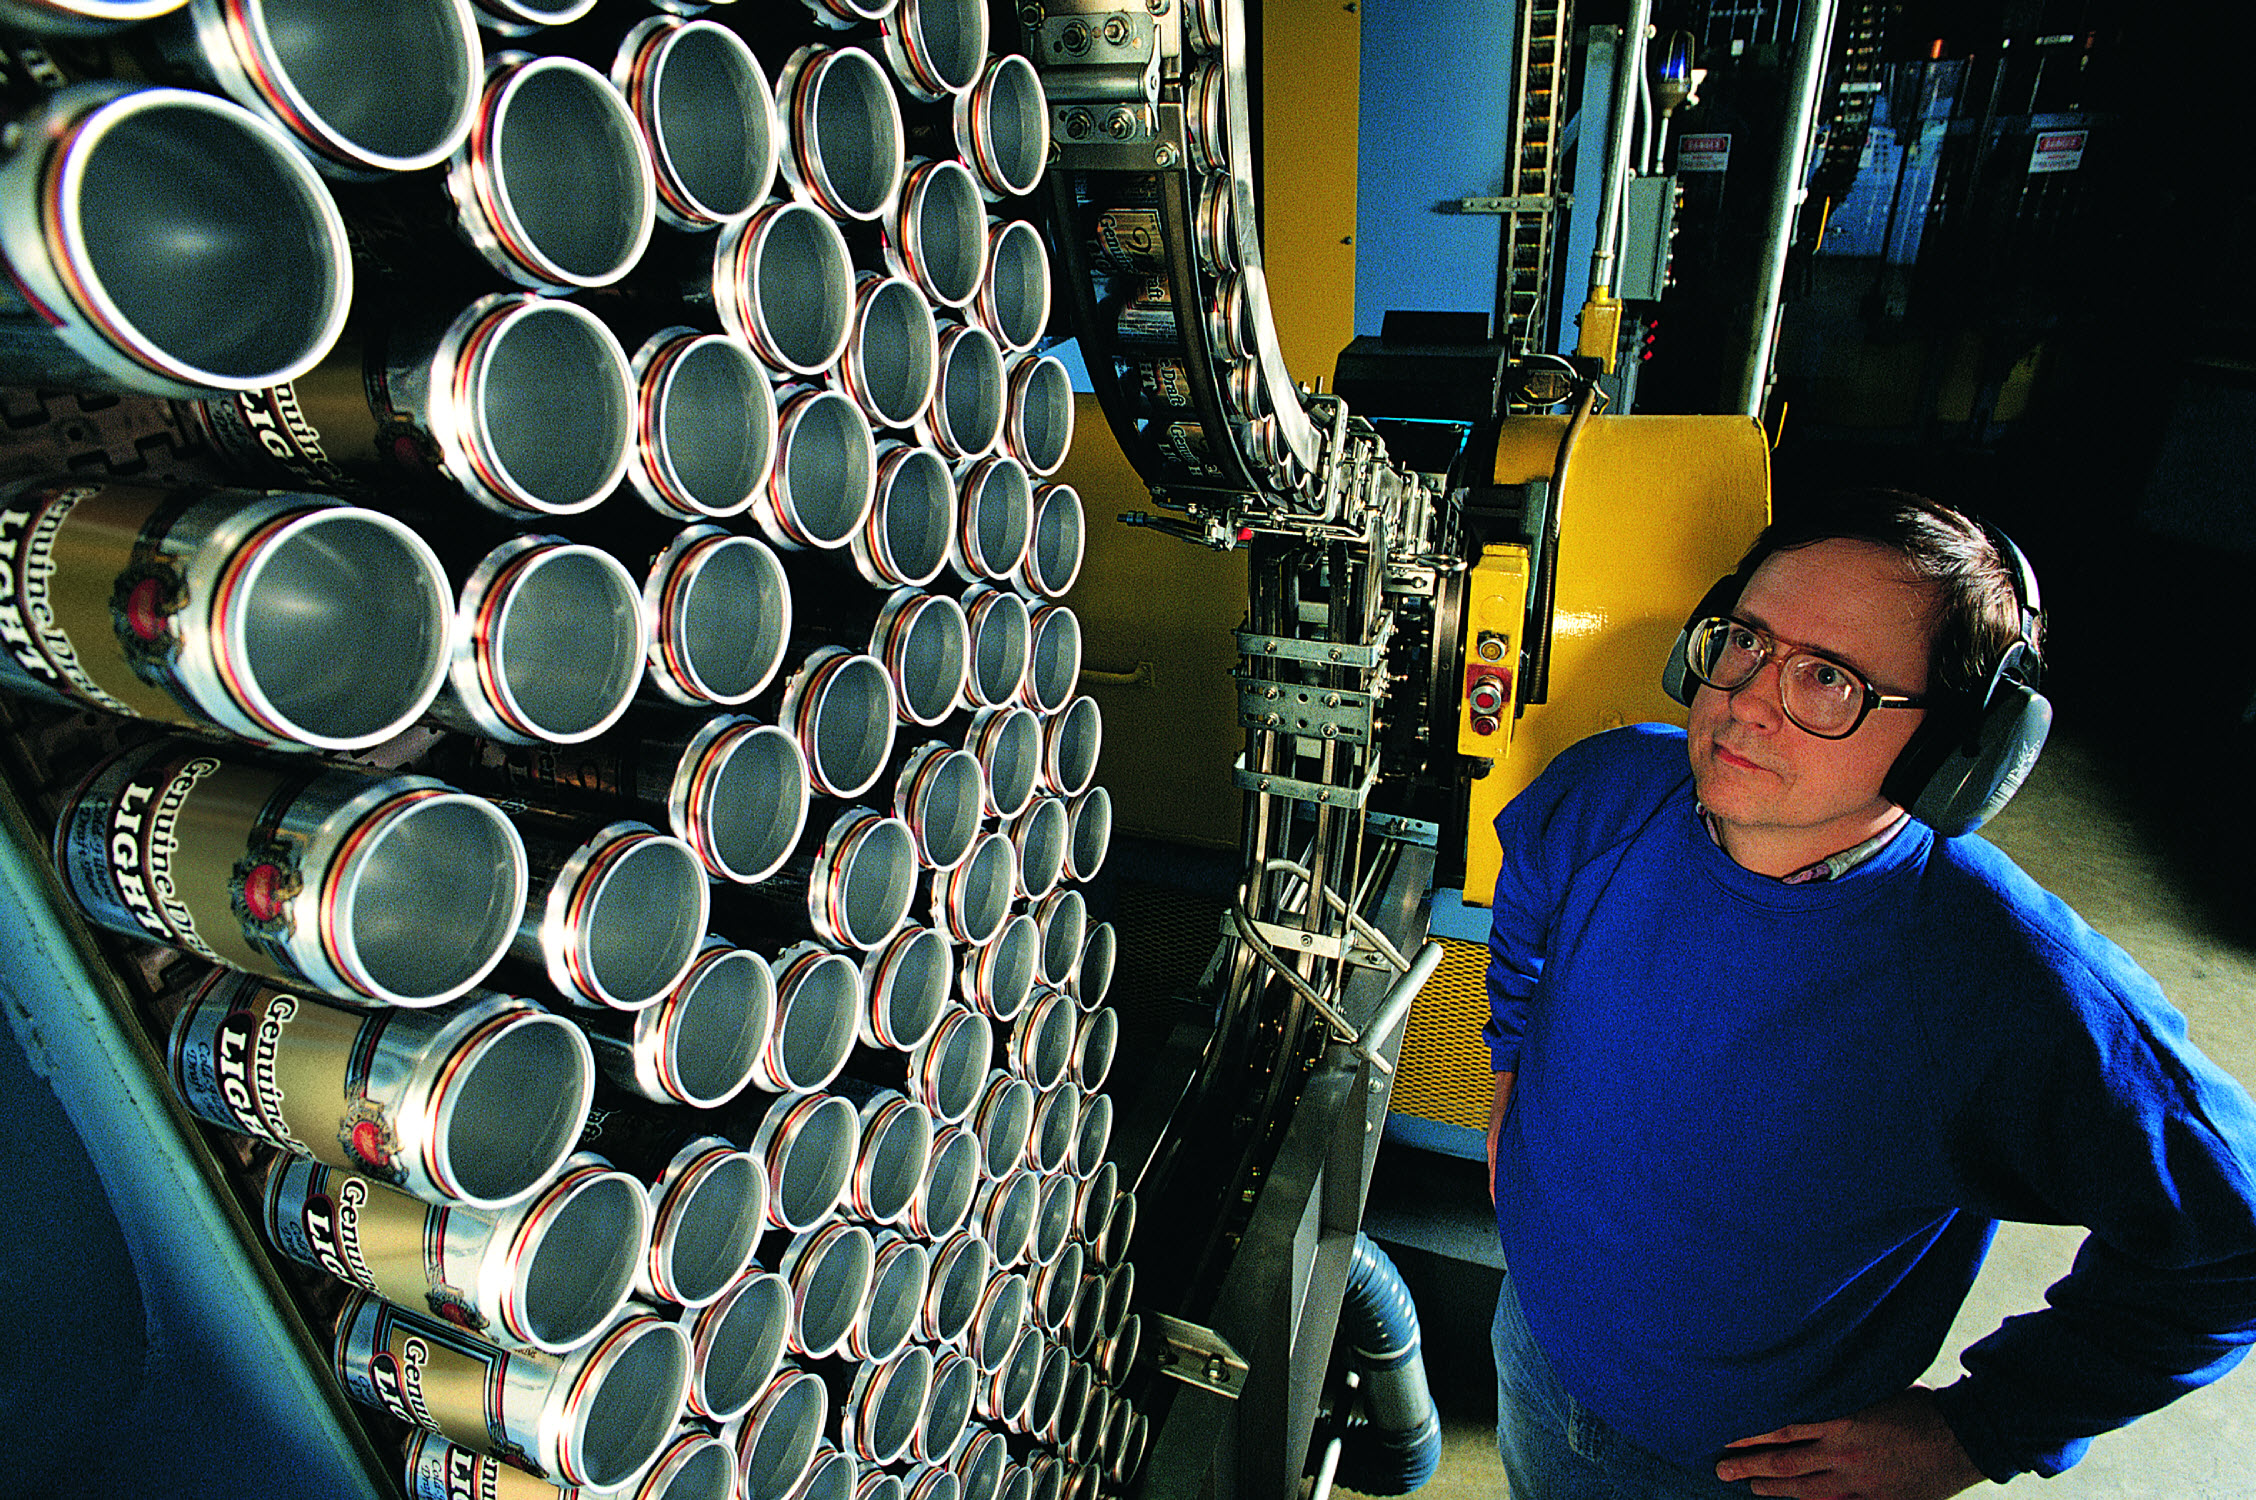
Reducing Startup Time in Container Production
This study examines a high speed container making process that makes multiple products. Historically, it has required excessive startup and changeover times to become stable enough for normal production. Before the study period, process startup routinely took between 60 and 90 minutes to reach stable performance and produce product that met specifications. Product changeovers were consuming up to two hours.
The solution is to apply SPC and Process Capability Analysis to monitor the startup and restart processes and make informed decisions to improve performance. The steps in the process are:
- Increase sampling rates during the startup cycles to better understand the causes of variation.
- Apply SPC control charts to monitor process variation and determine when the process is stable.
- Use process capability analysis to determine when the process is capable to meet specifications.
- Start full production when the process is shown to be stable, predictable and capable.
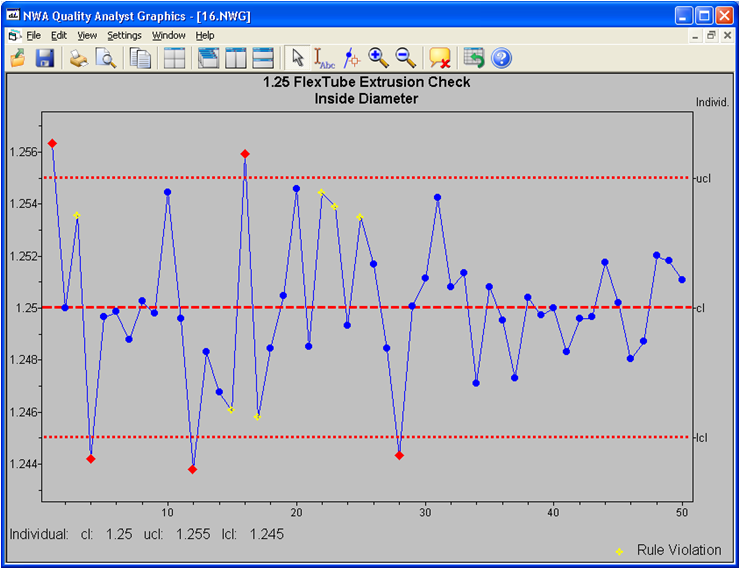 SPC control charts (figure 1) are used to determine when the process becomes stable. The quality staff uses a higher sampling rate during startup to better understand process behavior. The control charts are used to identify sources of variation and opportunities for improvement, and monitor the process improvement efforts. This enables the quality department to see the process stabilize in real time and reduce variation and scrap.
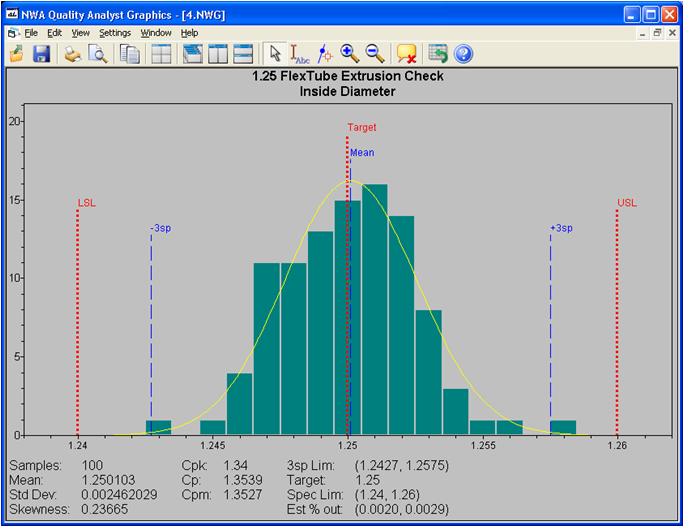 Process capability analysis (figure 2) indicates when the process becomes capable of producing good containers that meet specification with lowest possible scrap rate.
Results:
After following the above process, startup time was reduced to an average of thirty minutes and changeover time reduced to 45 minutes. This resulted in more predictable initial run quality with fewer shutdowns.
The strategy of applying SPC to startup time reduction produced the following benefits:
- The improved system delivers 60 to 90 minutes more production time per run.
- The line experiences fewer start/stop/restart incidents and produces less scrap.
- Manpower and equipment utilization is significantly improved
- The OEE rating is substantially increased.
- Faster changeovers allow more production flexibility.
These improvements will enable the company to become a more responsive and profitable vendor. They also reduce further capital requirements by increasing production capabilities with existing lines.