We often hear control limits and specification limits discussed as if they are interchangeable. But control limits and specification limits are completely different values and concepts. What is the relationship between control limits and specification limits? Usually there is no relationship whatsoever.
Control limits are calculated from process data for a particular control chart. An X-bar chart and an Individual measurements chart will have different limits.
Specification limits are chosen in numerous ways. They generally apply to the individual items being measured and appear on histograms, box plots, or probability plots.
The table below contrasts control limits and specification limits:
| Control Limits | Specification Limits |
| Voice of the process | Voice of the customer |
| Calculated from Data | Defined by the customer |
| Appear on control charts | Appear on histograms |
| Apply to subgroups | Apply to items |
| Guide for process actions | Separate good items from bad |
| What the process is doing | What we want the process to do |
Confusing control limits with specification limits leads to mistakes. The most common mistake is to use specification limit values instead of control limit values on an X-bar chart or an Individuals chart. Using specifications on an X-bar is the most egregious error: the specifications are in one unit (items) while the chart is in another (average of several items).
Even using specification limit values on an Individuals chart leads to problems. Unless the specification and control limit values are identical, one of two errors occurs:
- The control limits are set too tightly. This leads to over-adjustment and tampering with the process. Tampering adds to process variation, resulting in lower quality and higher costs.
- The control limits are set too loosely. Signals of process change are ignored and opportunities for process improvement are missed. The result is additional avoidable variation, lower quality, and higher costs.
How about showing specifications on the control charts in addition to the control limits? The leading SPC solutions allow this, but it's generally not a good idea. Additional limits risk confusing customer demands with process behavior. The additional limits void the wonderful ability of control charts to give clear guidance. The only good use of specification limits on a control chart that I've seen is to make a point when the process is operating nowhere near the specifications.
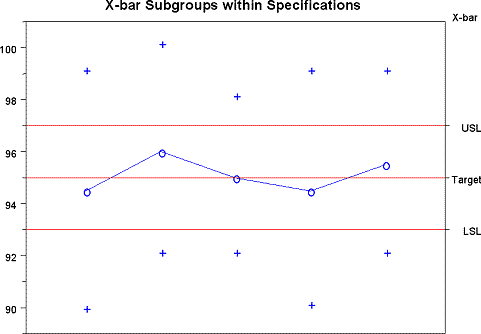
Concerning specifications appearing on an X-bar chart, the X-bar chart below illustrates the problem. The subgroup size is two, and the Target and Specifications (rather than Center Line and Control Limits) have been added to the chart. All of the subgroup averages (the "O"s) are within the specifications. But all of the measurements making up the subgroups (the "+"s) are outside the specifications. The items are all either too large or too small; but on the average they're just right!

In summary, use only control limits on control charts; specification limits belong on histograms, box plots, and probability plots.

